 Skip to main content
Global Markets on Edge: Dissecting the Recent Selloff
August has started with some volatility in investment markets with a number of causes and effects which we will go into in this update, along with some forward-looking discussion. Hopefully this is informative and places the current moves into a wider context. As always, we stress that the recent activity reinforces the need for a portfolio that is diversified across geographies, economic sectors and asset classes, and that risk portfolios should be viewed as long term to reduce the impact of volatility.
Arrange your free initial consultation
Starting with the macroeconomic context, inflation had been steadily falling through the year and there were initial signs of the economy cooling, although the speed/magnitude of the economic slowdown was not clear. Prices are set by the relative match between demand and supply, meaning falling inflation can reflect rising supply or falling demand - markets had been increasingly leaning towards falling demand as the main cause, especially as retail sales numbers began to falter and consumers increasingly found it harder to obtain credit. The labour market looked like it was becoming more balanced, with wage growth slowing and vacancies falling, but the fear was that this process would continue, leading to excessive unemployment and a rapid slowdown in economic growth.
In markets, the context was of overstretched technology valuations resulting from a small number of tech firms driving the bulk of market returns over the last couple of years, as well as very low levels of volatility. While markets frequently display momentum characteristics in which existing trends amplify themselves, in this case tech outperformance and low volatility begetting further tech outperformance and lower volatility, they also eventually correct themselves. The painful element is the rapidity of that snap-back to reality. Over the last few weeks investors started to question the ability of tech firms to drive near-term profitability from their enormous capital investment in AI models and infrastructure, bringing this correction event closer into view.
A final markets context was the extent of the Yen “carry trade”, in which investors from around the world borrowed at low rates in Japan to buy higher yielding/returning risky assets abroad. The scale of this trade is disputed, but numbers as high as $2tn or even $4tn have been proposed. When volatility is low and Japanese interest rates remain pinned to the floor this trade can pay off handsomely, however a rise in Japanese interest rates and rapid strengthening of the Japanese Yen can throw this trade off and cause investors to sell the risk assets they bought using borrowed Yen.
The crowded ‘long-technology vs short-small cap’ trade starts to unwind
A very popular trade, particularly for large institutional investors, has been to go long US tech balanced against a short position in US small caps. This means buying US tech paired against selling of US small caps. This trade is usually implemented with significant leverage to boost returns. US tech has seen strong earnings growth while small caps have been squeezed particularly hard by high interest rates, leading to outperformance of US tech, rewarding those in this trade.
As investors became increasingly worried about economic growth in mid-July there was a deleveraging (selling down) of this position. Institutional investors often use leverage for both the long and short side of the trade, so as they cut their overall leverage, they are forced to buy back the stocks they are short and sell the stocks they are long. This meant buying small caps and selling tech. You see this in the returns below, in which small cap (white) rallied and tech (orange) sank from July 11th to 31st:
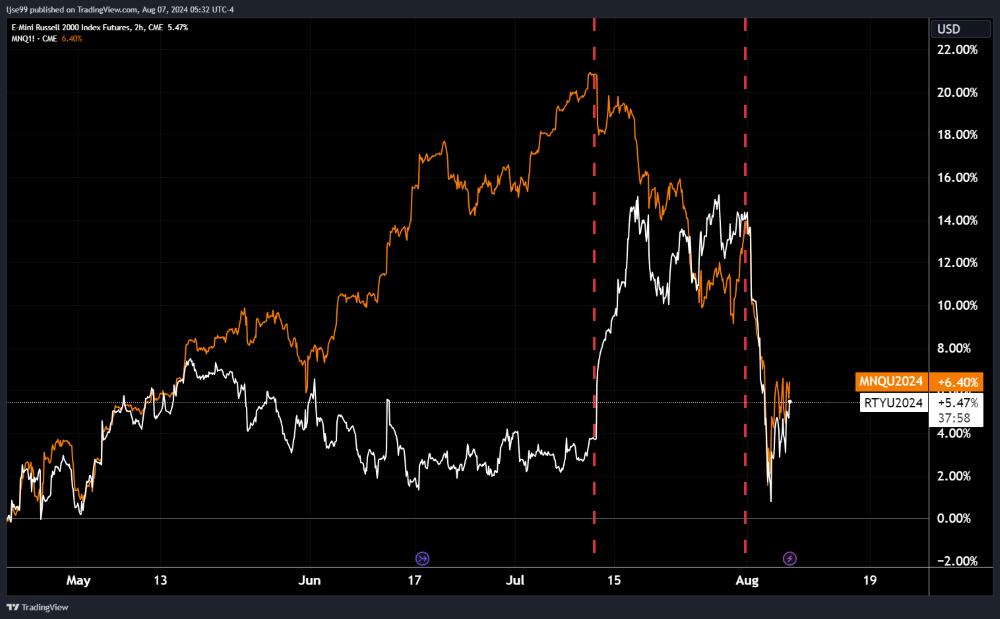 Figure 1 – NASDAQ Index (orange) and Russell 2000 Index (white) returns – Source: TradingView 2024
Japan raises rates, unwinding the “carry trade”
Japan has maintained unusually low interest rates relative to peers in an attempt to spur economic activity and introduce a moderate level of inflation to their long-deflating economy. An unfortunate side-effect has been significant currency weakness.
For those borrowing in Yen to buy foreign assets (the “carry trade”) a weaker Yen is beneficial, as it effectively cuts the cost of your borrowings relative to the value of the foreign asset you have bought – for example, if your borrowed 100 Yen to buy $100 of US assets at a 1:1 rate, but then Yen devalues such that $1 now gets you 2 Yen, you could sell just half of your $100 of assets to fully pay back your 100 Yen borrowings, leaving you in $50 profit. However, that same process works in reverse when the Yen strengthens, potentially pushing the investor to have to sell up their foreign assets to pay back their Yen borrowings.
Last week saw Japanese labour market data released showing a ~5% rise in wages for unionised workers, leading the Bank of Japan to conclude that there was a risk of inflation pushing beyond the moderate levels they targeted and becoming similar to the issues seen in Europe in 2022/3.As a result, they chose to raise interest rates by 0.15%. While the raise itself was small, the signal to markets was large and caused Japanese bond yields to rise in expectation of further rate hikes.
The Japanese Yen then rallied hard, shown in the chart below:
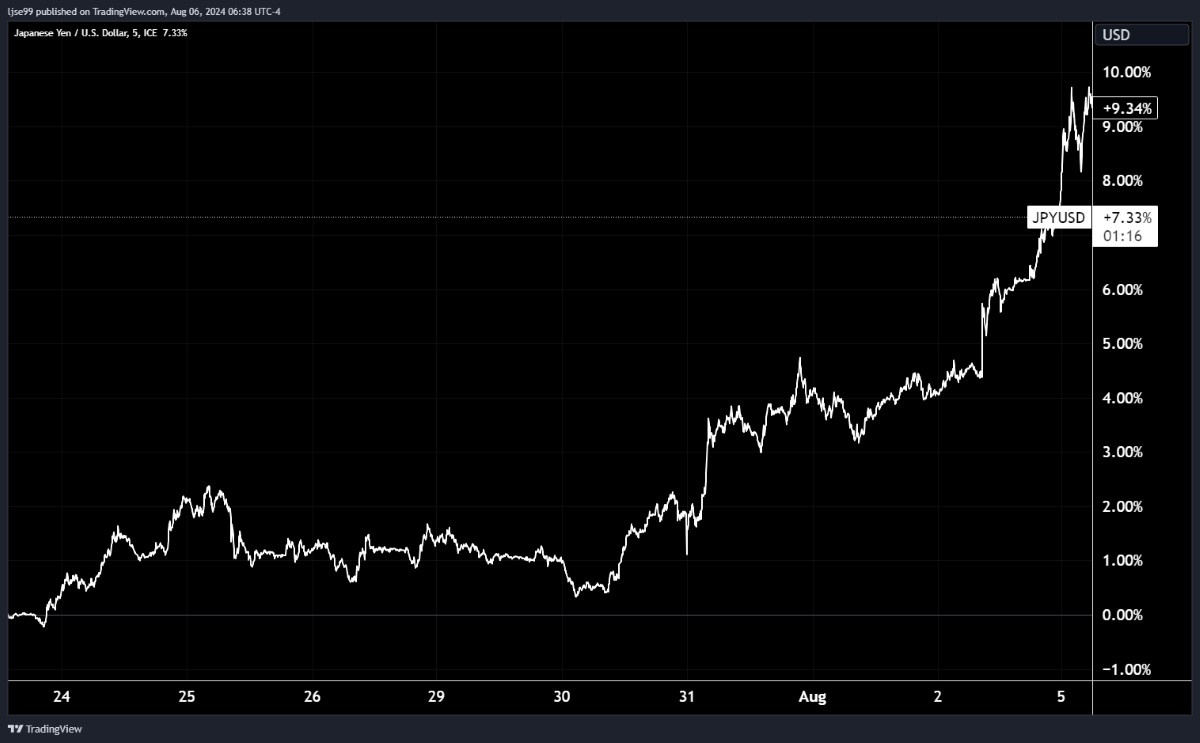 Figure 2 - Japanese Yen versus US Dollar - Source: TradingView, 2024.
Many investors were therefore forced to sell their foreign risk-assets to pay back their Yen borrowings.
Israel-Iran tension rise, increasing geopolitical risk
Although this is not the primary driver, it certainly has contributed to the overall risk-off attitude. Rising tensions in the middle east following Israel’s assassination of Hamas leadership on Iranian soil, along with further Israeli attacks in Syria and Lebanon, led Iran to threaten retaliation and an escalation in tensions. Oil prices jumped and geopolitically sensitive assets dropped, indicating a rise in geopolitical risk premium.
US labour market data indicates the beginning of a recession
Before anything else, it should be stressed that for a recession to be unequivocally marked there needs to be decline in the following 4 indicators: industrial production, personal incomes, employment and retail sales volumes. Friday’s employment data points to the start of employment problems, so is not the official start of a recession, however if those trends in employment persist it can be expected that the other three components also deteriorate.
What was the data? The US economy added 114,000 jobs in July, below the roughly 200,000 jobs needed to keep up with population growth. This meant that unemployment rose sharply from 4.1% to 4.3% in July, up from 3.4% in April 2023.
Historically the US unemployment rate has never risen 1% without a recession occurring shortly afterwards. A similar concept, the Sahm rule, was also triggered, which states that a recession is entered when the 3-month average of unemployment is 0.5% above the minimum unemployment rate of the previous 12-months. Please see the Sahm rule chart below.
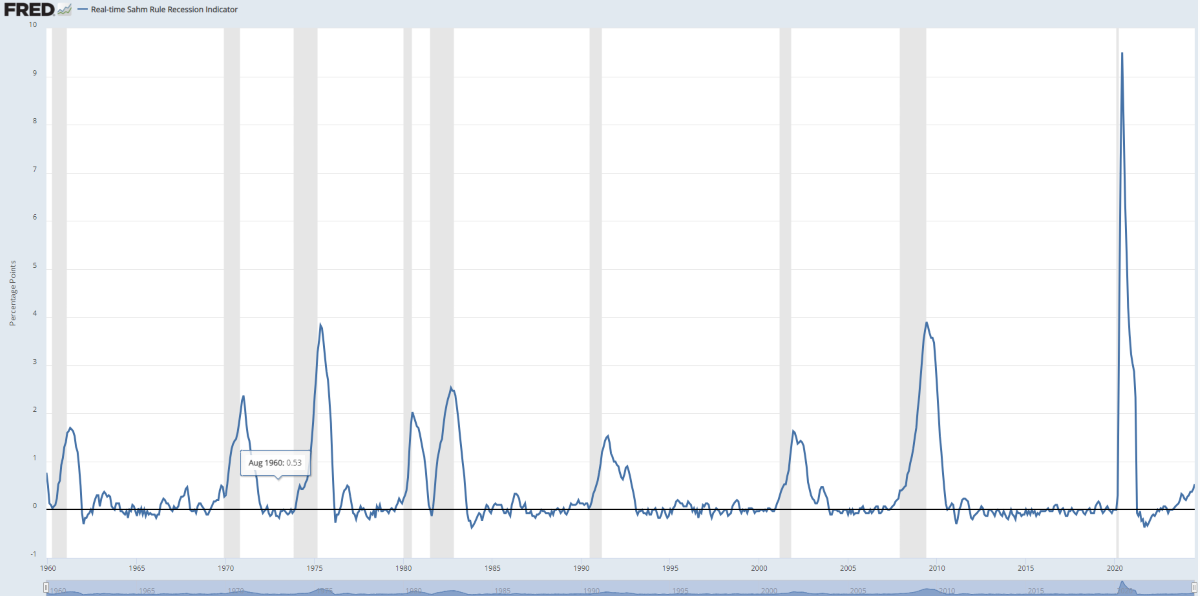 Figure 3 – Sahm Rule, with US recessions shaded – Source: Federal Reserve Bank of St Louis, 2024.
With investors now firmly in the recessionary camp, equity selling became rather indiscriminate, with few names remaining unscathed. Our next section will cover the market moves.
Market moves
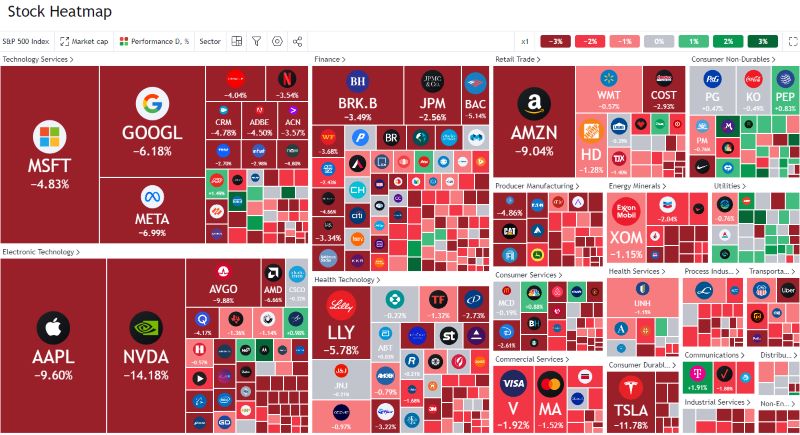 Figure 4 – US stock market heatmap at the US market open 05/08/24 - Source: TradingView, 2024.
Starting with equity markets, the heatmap above shows US equity sectors as US markets opened on Monday. Defensive sectors like consumer staples (labelled consumer durables) and utilities saw positive performance, while most other sectors have seen rapid declines. Notably, many of the most overvalued technology names saw the most rapid price declines. Through the trading day equities subsequently rebounded and regained much of the value they lost. Although equities rebounded, volatility is high, with the VIX volatility index hitting 49 intraday and settling closer to 30; 49 is a level last seen during the 2020 COVID crash:
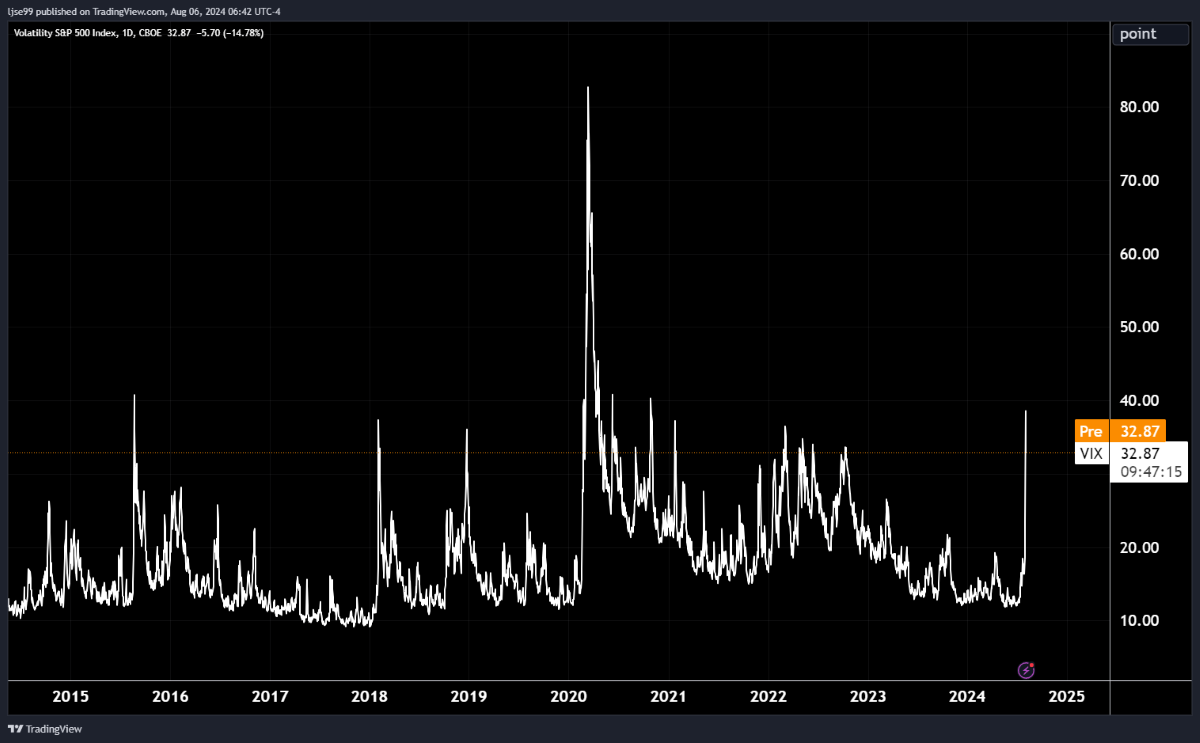 Figure 5 – VIX Volatility Index – Source: TradingView, 2024.
On a country level selling was fairly indiscriminate, and Japan, which is at the centre of the carry trade, was hit hardest:
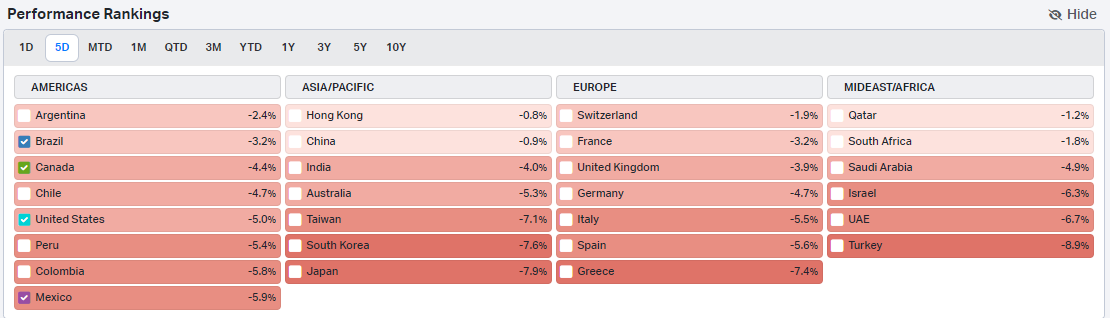 Figure 6 – National stock market returns 05/08/2024 - Source: Koyfin, 2024.
In the following hours, particularly the second half of the US trading session, Japanese equities also rebounded and made up around half of their losses.
In terms of currencies, there has been a strong safe-haven effect, as investors pull money home, or crowd into currencies perceived as safe havens. Unsurprisingly the Japanese Yen has rallied hard as the increase in Japanese interest rates has made it more attractive, continuing the strength that originally unwound the carry trade. The Swiss Franc, a typical safe-haven, has rallied. The Euro has seen repatriation flows from nervous European investors. All are typical signs of risk-off mentality.
Finally, moving to bonds and fixed income where the safe-haven effect has also been very apparent. Investors crowded into safe government bonds, betting on imminent emergency rate cuts (more on this below). High yield credit sold off, as investors bet on slowing growth causing increased corporate bankruptcies.
The rapidity of this recent move in fixed income yields is quite extraordinary and is well characterised in the following graph, showing US 2-year yields in white and US 10-year yields in orange:
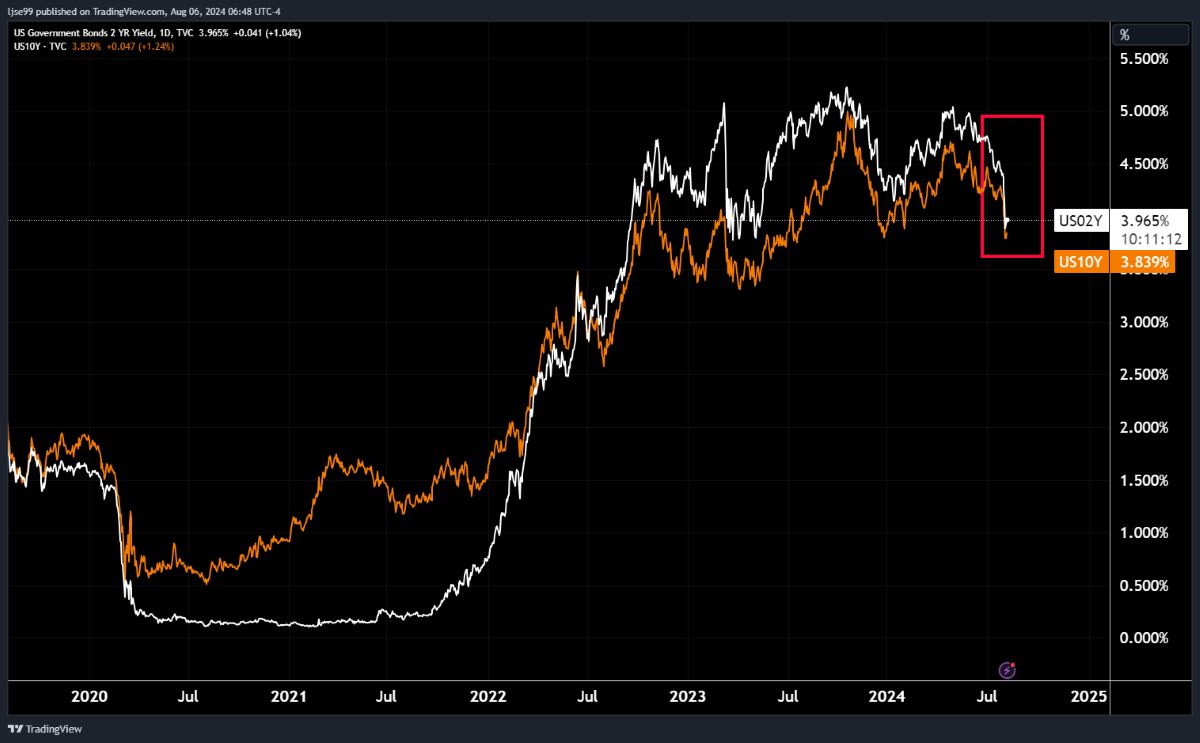 Figure 7 – US 10-year (orange) and 2-year (white) yields – Source: TradingView, 2024.
Yields declined -0.5% in the space of hours– you would normally expect to only see moves this large once every 10 years. Bond yields gyrated rapidly through the day, with the US 2-year yield subsequently gaining 0.3%, leaving the net daily change in yields close to –0.2%.
Where do we go from here?
The Federal Reserve just had a Federal Open Market Committee (FOMC) meeting in which they chose to keep rates on hold, in contrast to the Bank of England who cut rates. Markets are now assigning a 16% probability to an emergency rate cut in the next two weeks. Beyond that, they are also predicting a double rate cut at the September FOMC meeting, 5 rate cuts by the end of 2024, and 7 cuts by March of 2025. If markets are correct, that would leave interest rates below 4% for the first time since December 2022.
While this will certainly bring hope to investors in government bonds, as mechanically they will have to appreciate in value as interest rates fall, the outlook for risk assets is more sanguine. History has shown that Central Banks cut interest rates just as an economy enters recession and do not prevent recession (although they may shorten it), and risk assets typically fall in the 6-24 months following the implementation of a cutting cycle – it took until March of 2009 for equities to bottom out, yet rates were first cut in August of 2007, meaning nearly 2 full years of declines. That said, circumstances are very different now compared with 2008. Banks are much stronger and better regulated so a credit crunch is unlikely. However, this could mean that we are possibly in for a bumpy ride in the near future.
Economies enter recessions when imbalances, whether in the financial system or real economy, become too extreme to paper-over and lead to outright ruptures. In 2007 the main imbalances were between booming sub-prime home lending and deteriorating borrower credit quality, along with extreme imbalances in commercial bank balance sheets. This blew up, but it laid the foundations for more sustainable growth from 2009 onwards that no longer relied on excessive buildup of household debts. Similarly, we now see enormous imbalances between the outcomes of large and small companies, in trading relations between the US and China, in demand and supply of commercial real estate, in US budget deficits versus economic growth. While a recession, if it happens, will be painful, it will also hopefully allow for future growth that is built upon more sustainable foundations. Additionally, from an investor perspective, will allow for enticing entry points into risk assets for those who are in their accumulation phase.
Let us hope, however, that this all turns out to just be a growth scare, rather than an actual recession.
There are ways to ensure that turbulent market environments do not have a significantly adverse impact on your invested wealth. Investing for the long term and picking appropriate risk mandates helps ensure that you will not need to draw on money that suffers greatly from short term volatility. At The Private Office we invest our clients wealth in portfolios which have been selected to benefit from long term growth in line with each individual’s needs and objectives. If you have any questions about your portfolio, please contact your adviser.
Arrange your free initial consultation
The information in this article is correct as at 07/08/2024.
This Market update is for general information only, does not constitute individual advice and should not be used to inform financial decisions. Investment returns are not guaranteed, and you may get back less than originally invested; past performance is not a guide to future returns.

How much is the dividend tax free allowance?
The recent change of Government in the UK has naturally brought with it a number of speculations about what Labour will look to target when it lays out its fiscal policy for the term ahead. You will have heard about potential changes to Capital Gains Tax (CGT), or modifying Inheritance Tax (IHT), however there have been significant changes in recent years to many other areas, and one in particular is the dividend allowance. It has shrunk dramatically in recent years, from £5,000 per annum in 2017/18 to £500 per annum in 2024/25. It is important, then, that if you are getting income from dividends, you need to understand your tax implications.
Arrange your free initial consultation
What is a dividend?
Dividends are periodic payments made to shareholders by the companies they have invested in. It is a slice of the company’s post-tax profits that is ‘divided up’ among its shareholders. Clearly, the dividend amount is variable and is dependent on strong corporate performance in order for them to pay out to shareholders.
Is there a tax free Allowance for dividends in the UK?
In the UK, HMRC allows individuals to receive a certain amount of dividend income before they start paying tax, known as the dividend tax free allowance.
This allowance was first introduced on 6 April 2016 to all UK residents, replacing the dividend tax credit at that time.
Although in the UK we can utilise the dividend allowance, recently the amount at which you can earn before paying tax was reduced, meaning more people will have started paying tax on their dividend income.
What is tax free dividend allowance?
For the 2024/25 tax year, the dividend tax free allowance is £500. This means that you can receive income of up to £500 from shares and some equity-based collective investment funds without paying any tax.
Dividends that arise within ISA and pension wrappers are exempt from dividend tax due to the favourable tax-free growth nature of these investments.
Understanding tax on dividends
Once the amount of dividend income an individual receives breaches the dividend allowance, the level of tax you pay on this income depends on what level of total income you receive in any given tax year.
| Tax Band | Income Level | Income Tax Bracket | Dividend Tax Bracket |
|---|---|---|---|
| Personal Allowance | £0-£12,570 | 0% | 0% |
|
Basic Rate |
£12,571-£50,270 | 20% | 8.75% |
| Higher Rate | £50,271-125,140 | 40% | 33.75% |
| Additional Rate | Over £125,140 | 45% | 39.35% |
The above table shows the level of tax you will pay if you receive more than £500 worth of dividend income in the current tax year. If your total income for the year is less than the Personal Allowance, which sits at £12,570 in the current tax year, you will also not pay tax on your dividend income.
As per the table above, dividend tax rates are less than income tax rates, making dividends a more favourable form of income. Individuals who own their own limited company can take dividends from the profits of their company instead of a salary in order to decrease their tax liability for a given tax year.
Can I transfer tax free allowance to share dividend allowance?
Although it is not possible to transfer your dividend allowance to your spouse, like it is with part of the Personal Allowance, transferring dividends to your spouse is an effective way to mitigate dividend tax if one member of the couple falls into a lower tax bracket than the other. As assets can be passed between spouses free of inheritance tax implications, assigning shares to the lower earner means that any dividend income they receive over the dividend allowance will be taxed in accordance with their relevant, lower rate of dividend tax. For this to be effective, the transfer of the shares/investment should be a genuine and unconditional transfer of ‘beneficial’ ownership, from which the transferor should receive no benefit.
Please keep in mind this is a complex area of taxation and such work should be undertaken with help of your accountant or financial adviser.
How do I pay dividend tax?
Unlike a salary, dividends are not taxed at source. If you earn under the dividend allowance of £500, you do not need to do anything. If you earn above this, but below £10,000 in the current tax year, you must contact HMRC. HMRC will give you the option of either adjusting your tax code to pay your dividend tax liability or completing a self-assessment tax return.
If you earn over £10,000 of dividend income in the current tax year, your only option for paying your dividend tax bill is by completing a self-assessment tax return.
Self-assessment tax returns must be completed for the previous tax year by 31st October if choosing to fill in a paper form or 31st January if you opt of an online form. For example, you must complete your online tax return for the 2023/24 tax year by 31st January 2025.
How we can help
Whether you are a business owner who would like to efficiently draw an income from your business, or you are receiving income from your investments, we can build an effective, tax efficient income strategy that suits you and your family's needs. We make it a priority to stay on top of legislative changes to taxes applicable and work with a number of client accountants to ensure we have the most up to date tax information available for each client.
If you’d like to learn more about how we can help you, why not get in touch for free initial review with one of our expert advisers.
Arrange your free initial consultation
The FCA does not regulate estate or tax planning.
The information is based on our understanding of legislation, whether proposed or in force, and market practice at the time of writing. Levels, bases and reliefs from taxation may be subject to change.

Election Season – Is a shift to the left, right for markets?
In last month’s update we touched upon the French and British general elections, however at the time of writing the UK election hadn’t yet taken place and the French election had only passed its first round. Now that both elections have concluded we can take a deeper dive into market reactions.
Arrange your free initial consultation
The election results
Before we get going it’s worth summarising recent events, starting with the UK. Pollsters had been predicting a Labour landslide, and while they overestimated the realised vote share for Labour, due to our first-past-the-post voting system this still translated into one of the largest majorities our parliament has seen. This result should provide the foundation for a stable government with the ability to enact its desired agenda.
In France results were less conclusive, in part due to their more proportional voting system. Le Pen’s National Rally party won the largest vote share of any individual party, however due to the fractured nature of their parliament, with three roughly equal coalitions, it seems unlikely that a government will be formed in the very near term. This will not provide the foundation for a stable government with the ability to smoothly enact its desired agenda.
Market reactions to the UK election result
The UK had looked like a bit of a political basket case over the last few years, so the contrast of that to a new stable government is stark and has not been lost on international investors. The first port of call for market reactions to government policy, particularly the reactions of international investors, are the currency markets, where sterling has seen significant strength since the election results. Because the results were fairly certain, currency markets began to price-in a Labour victory at the start of the election week, so the chart below starts there. The blue line shows sterling against the Japanese Yen, the yellow line sterling against the Swiss Franc, the white line sterling against the US Dollar, and the orange line sterling against the Euro.
 Figure 1 – Sterling versus major developed economy currencies – Source: TradingView, 2024.
As the chart shows, sterling has been strong against the major developed market currencies, with inflows to British markets pulling up the currency value.
The next port of call is the bond market. If markets perceive a new government to be more stable and fiscally trustworthy, they should demand less compensation for risk and thus a lower government bond yield. Looking at recent moves in the gilt market, this is the result we find.
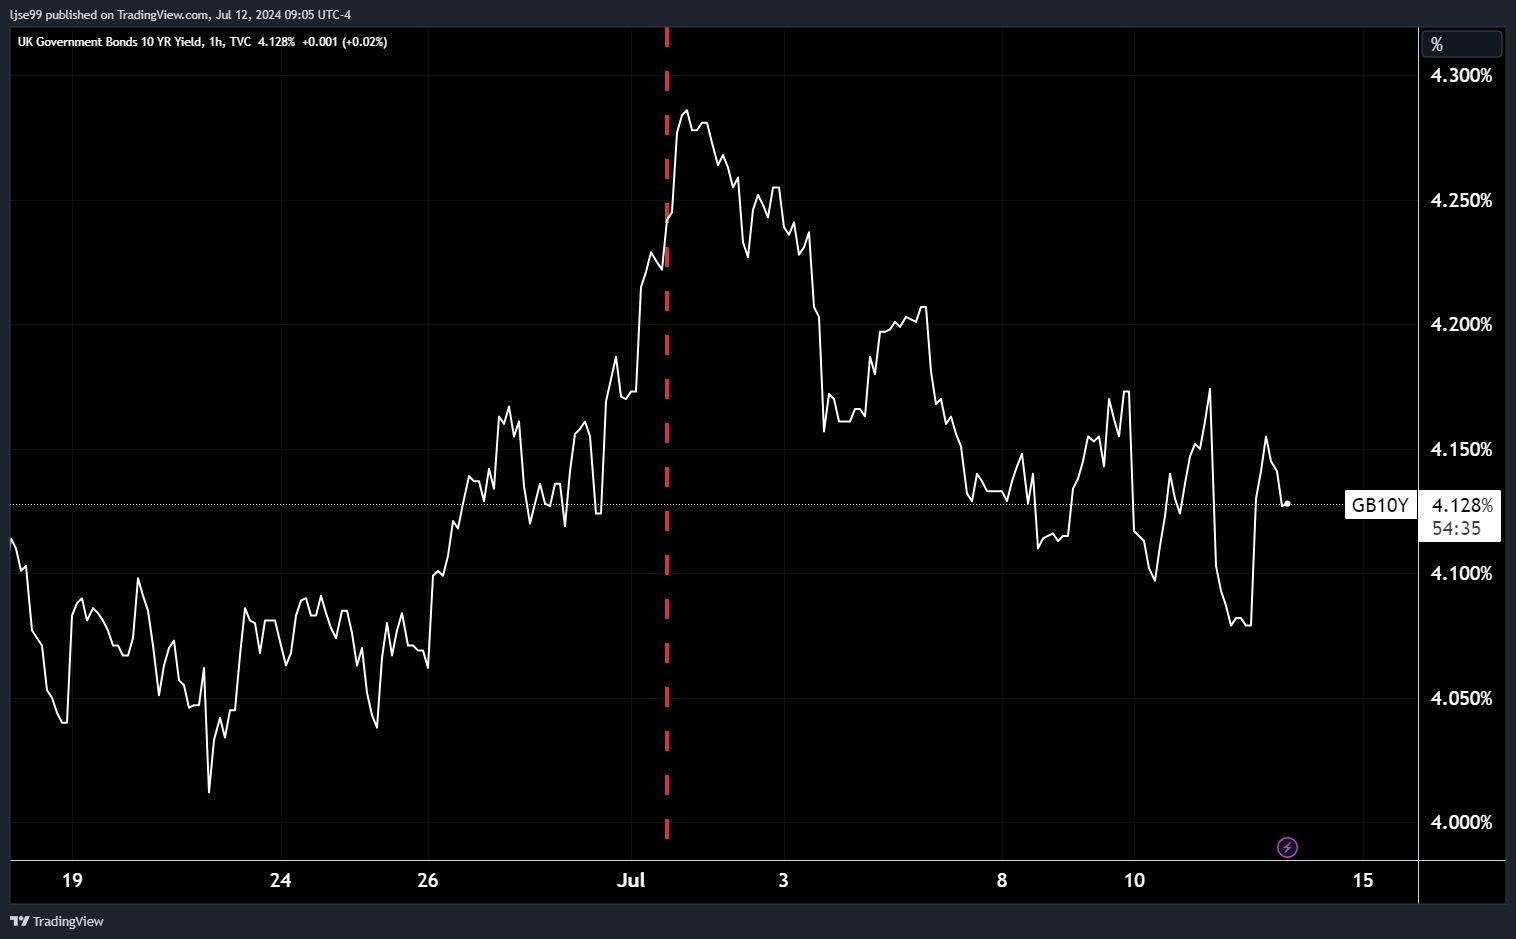 Figure 2 – 10-year UK Gilt yield – Source: TradingView, 2024.
The chart above shows the yield on a 10-year gilt over the last three weeks, with the beginning of the election week marked by the red dotted line. Clearly, since the start of the election week gilt yields have come down as would be expected.
The final market we will examine is the equity market. The two main index groupings of UK equities are the FTSE 100 and FTSE 250, where the former are the largest 100 companies, typically international businesses, and the latter are the next 250 largest companies, typically domestically focused. An election has the largest impact on the prospects of domestically focused companies, so we should expect the FTSE 250 to outperform the FTSE 100 if investors see the election as being positive for the UK economy, and within the FTSE 250 we should expect domestically focused sectors to see the strongest performance. The chart below shows the performance of the two indices, starting at the beginning of the election week. The FTSE 100 is depicted by the white line and the FTSE 250 by the orange line.
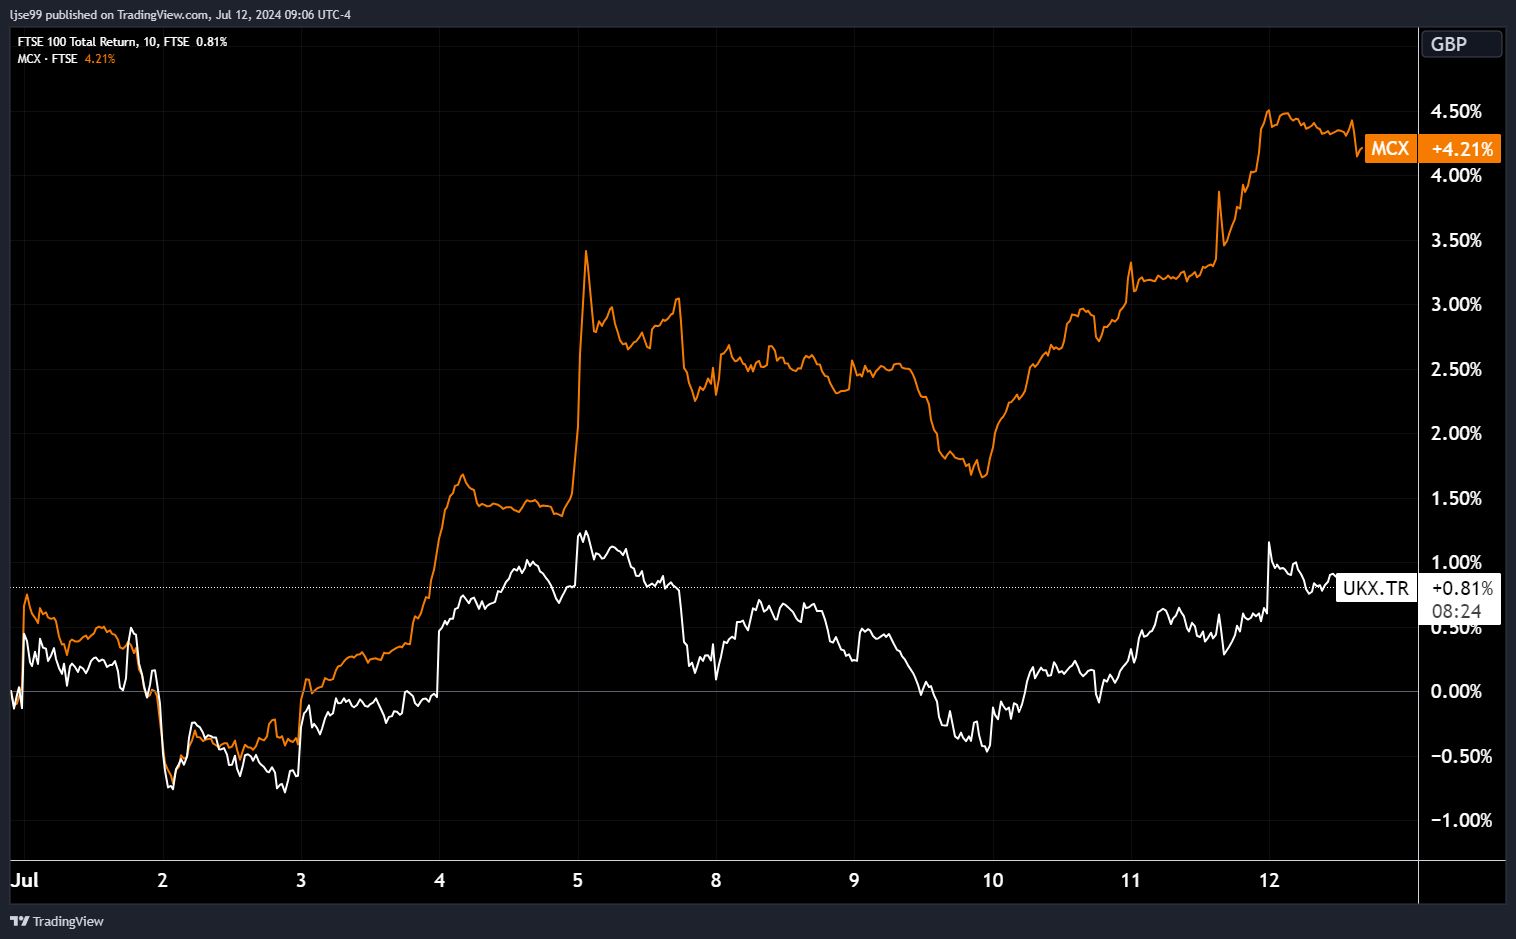 Figure 3 – FTSE 100 & 250 returns – Source: TradingView, 2024.
As predicted, the FTSE 250 has outperformed the FTSE 100 over the period, with a pronounced spike in returns on Friday the 5th, the day election results were confirmed.
When breaking this down on a sector basis, we see that of the 15 top performing FTSE 250 sectors that week, 7 are industries that are very domestically focused (highlighted in blue).
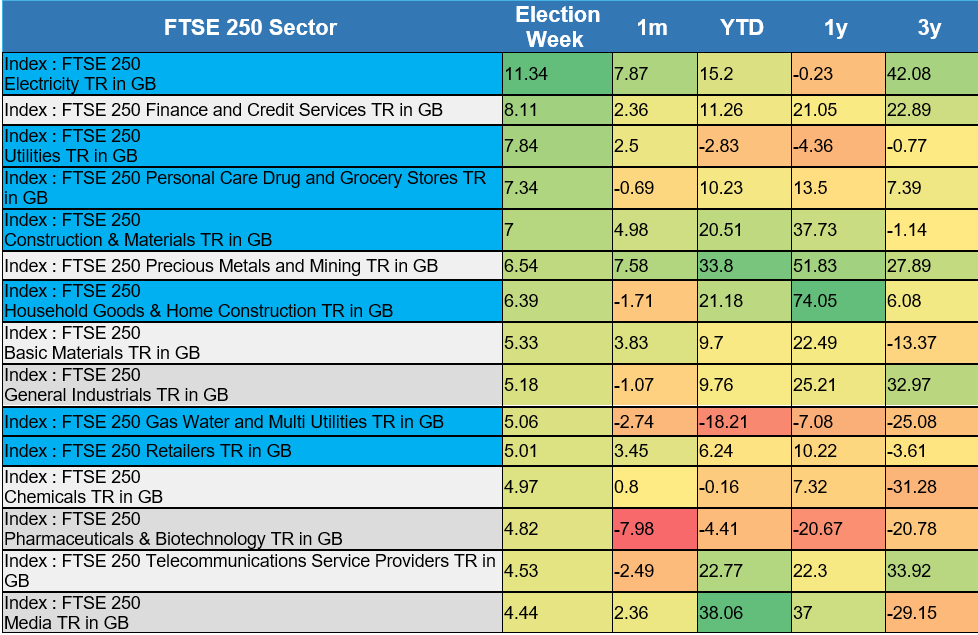 Figure 4 – FTSE 250 sector returns – Source: FE Analytics, 2024.
The strong performance of construction & materials and household goods & home construction sectors is notable, as house building is a key priority of the Labour government – markets are taking this seriously and pricing it into equity valuations.
Market reaction to the French election result
Moving to France, where markets have been less than enthused by the results, to put it mildly.
France no longer has the Franc as an independent currency, meaning changes in the value of the Euro are not a pure proxy for changes in sentiment towards France, however as the second largest economy in the EU, France exerts a large weight on the value of the Euro, particularly on the day of the election result. The chart below shows the value of the Euro versus the Dollar on the day of the election, with the drop in value boxed in red.
 Figure 5 – Euro versus Dollar – Source: TradingView, 2024.
As the chart shows, there was a significant uptick in volatility in Euro currency markets. This volatility isn’t restricted to currency markets, with equity markets across Europe seeing increased volatility, particularly when compared with UK equity markets. The chart below from Bloomberg shows the volatility of UK and European equity markets, with a clear spike during the election.
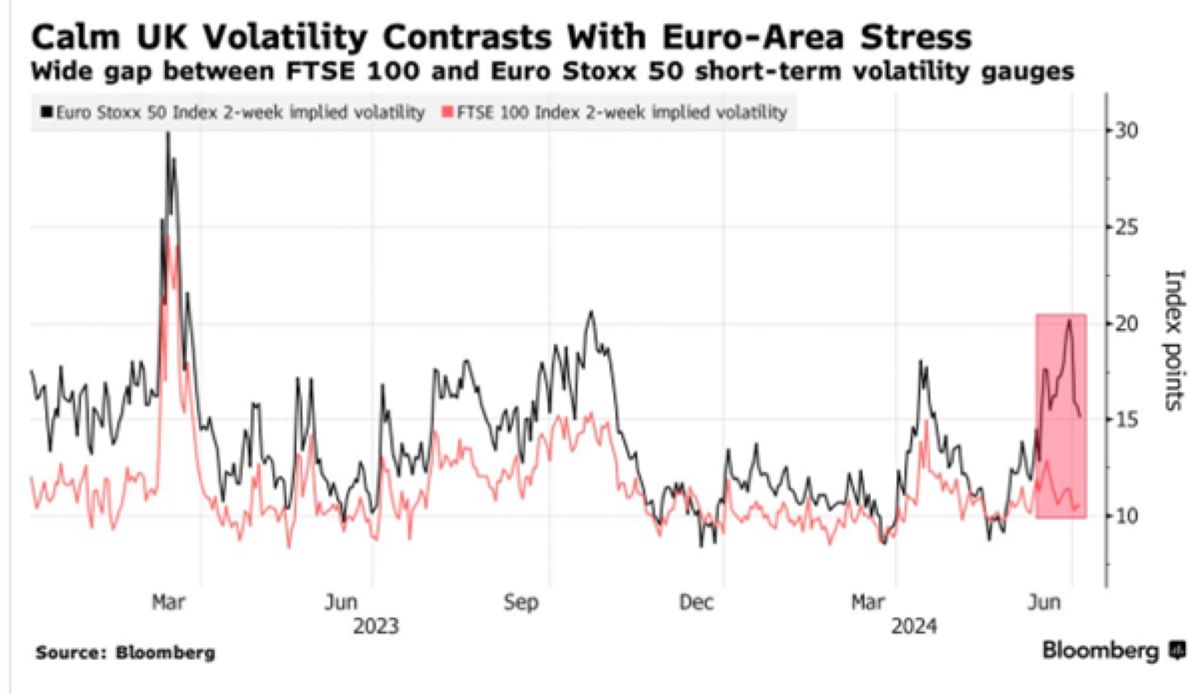 Figure 6 – UK and European equity volatility – Source: Bloomberg, 2024.
The chart above shows European equity volatility, but when breaking that down to look at the performance of French equities we see that much of this volatility has been caused by downwards moves in French markets. The chart below shows the returns of the French CAC 40 index in white and the German DAX 30 index in orange, with red dotted lines marking the calling of the election and the results of the election.
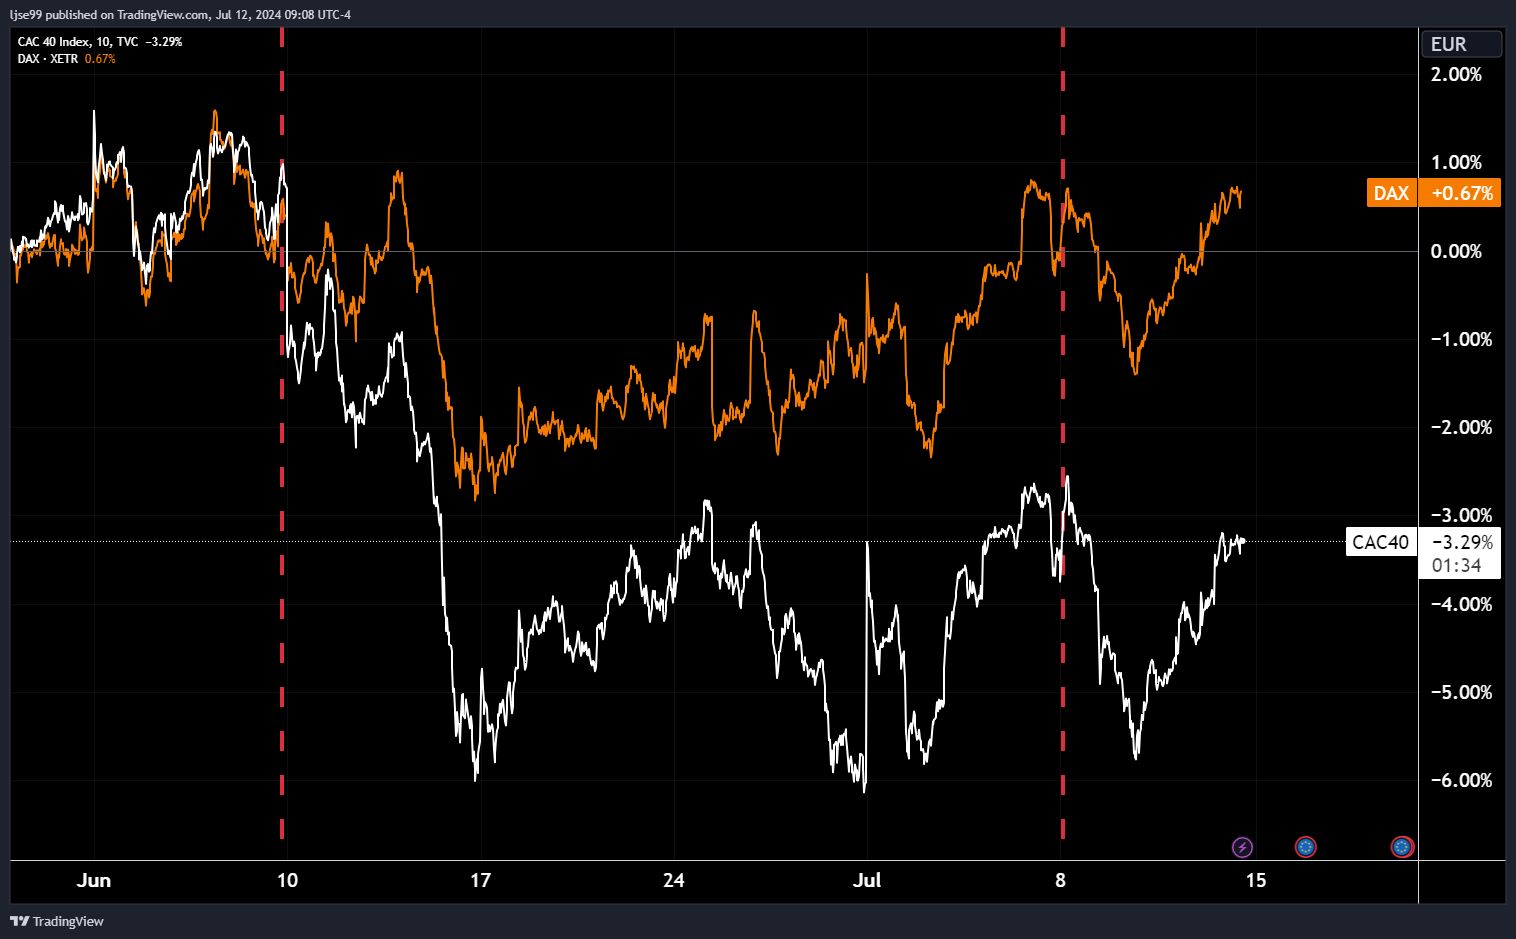 Figure 7 – French and German equity returns – Source: TradingView, 2024.
While German markets have moved broadly inline with French markets, downward movements have been less pronounced in Germany and recoveries weaker in France, with French equities exhibiting overall higher levels of volatility.
Finally, in fixed income markets the risks posed by the incoming French government are already being priced in, with bond investors demanding a premium to own French debt versus safer German debt.
What does this all mean going forward?
Looking purely from a market perspective these results are unambiguously good for UK markets. Valuations in UK markets have been particularly low since the 2016 Brexit vote and the subsequent political uncertainty, while France has attracted much inbound capital that would likely have landed on our shores. For so long as France remains politically unstable this is likely to reverse – we have already seen large Japanese and Taiwanese bond investors, primarily insurers, pull away from new French bond issuances and start to trim their holdings.
Outside of the France vs UK capital attraction comparison there is also the question of the FTSE 250, which having already got off to a good start looks primed to continue its strong performance – caveated with the fact that external factors, like a global recession, could easily blow things off course. Should the Labour government successfully implement their desired planning reforms and even get close to their target of the highest GDP growth in the G7, smaller UK companies can be expected to see material improvements in their business fundamentals, and with international investors finally giving the UK serious consideration, should also see the stock price gains to match. We remain cautiously optimistic for future UK market prospects.
If you have any questions about your portfolio please don’t hesitate to contact your adviser.
Arrange your free initial consultation
This market update is for general information only, does not constitute individual advice and should not be used to inform financial decisions.
Past performance is not a guide to future returns. Investment returns are not guaranteed, and you may get back less than you originally invested.
Can you cut your income tax bill if you're a high earner?
According to the Office for National Statistics, in 2023 to 2024 it has been estimated that almost 6.5 million people are paying higher or additional rate tax, a figure that has risen year on year and will likely continue in this fashion. This is mainly due to the 5-year freeze on allowances announced in the Budget 2021 and was extended for a further two years until April 2028 following the updates in the 2022 Autumn Statement.
Added to this, the Chancellor announced in the Spring Budget of 2023, that the amount you can earn before paying additional rate tax would be lowered, from £150,000 to £125,140 from April 2023, meaning even more people are dragged into the highest income tax bracket. Furthermore, the annual Capital Gains Tax exemption has fallen from £6,000 to £3,000 per person, per year and the tax-free Dividend allowance has fallen from £1,000 to £500. This creates a larger tax burden on all individuals and impacts the amount of tax planning each person should undertake.
Arrange your free initial consultation
Tax can have a big impact on your ability to preserve the value of your savings and investments in retirement. As such, one of the main focuses when advising clients, is creating a plan that helps them achieve their objectives in the most tax efficient manner. There are several ways to reduce the tax you pay on your annual income, especially if you’re in the higher or additional rate tax bracket.
What are the main taxes?
Income tax
Income tax is a tax imposed directly on your personal income. In simple terms, income tax is the tax on your earnings and is paid at 0% - 45% dependent on which of the income tax brackets you fall into.
Once your earnings exceed your personal allowance, you are required to pay tax on the following sources of income:
- Income from employment
- Income from pension
- Interest on savings
- Rental income
- Employment benefits
- Income from a trust
Capital Gains Tax
Capital gains tax is a tax on the profit made when you dispose of an asset such as an investment in an unwrapped environment (for example a direct share or general investment account) or any properties (other than the main residence).
The amount of capital gains tax you would pay on stocks and shares depends on the tax bracket the gains fall into when added on top of the income with any gains being taxed at either 10% (basic rate) or 20% (higher/additional rate), after taking into account the newly reduced (tax year 2024/25) capital gains tax allowance of £3,000. For the sale of property outside the main residence, the gains are taxed either 18% (basic rate) or 24% (higher/additional rate).
Inheritance Tax
Inheritance tax is a tax levied on any possession that falls in the individual's estate upon death. This tax can also apply to gifts made while the individual was still alive.
Inheritance tax is typically set at 40%, but if at least 10% of your estate is left to charity, the tax rate reduces to 36%.
An individual can leave up to a total of £325,000 (comprising of money, property, and possessions) without incurring inheritance tax. Additionally, an extra £175,000 allowance may apply if the main residence is passed on to direct descendants.
Why is tax planning important?
Tax planning involves minimising tax liabilities by utilising allowances, exclusions, exemptions and deductions to reduce owed taxes, so it should be an essential part of an individual’s financial plan.
Effective tax planning can be instrumental in savings individuals' money, maximising wealth and attaining your financial goals. By proactively managing finances, optimising tax liabilities and enhancing your overall financial wellbeing, individuals can ensure they are on track to meet their objectives.
What is higher rate tax?
In the UK, we do not get taxed on the first £12,570 we earn from our salary, bonuses, rental income, pensions, and other various income types - this is called our Personal Allowance. Income exceeding the Personal Allowance is then subject to income tax. This is banded so:
- Your earnings between £12,570 and £50,270 are currently taxed at the basic rate of 20%.
- Earnings from £50,271 and £125,140 at the higher rate of 40%.
- Anything above £125,140 is taxed at an additional rate of 45%.
The personal allowance and the higher rate threshold (£50,270) have been frozen until 2028 following an announcement by the Chancellor in the Autumn Statement 2022.
Although the rate of inflation is decreasing month on month, currently standing at 2.30% in June 2024, we have seen rates over the past year far exceeding the Bank of England’s 2% target rate, resulting in an increase for wages for individuals across the UK. Therefore, more people are and will continue to join the population previously pulled into paying 40%-45% tax on their earnings, so it is increasingly important we utilise the tax planning opportunities available to us to minimise the impact of the frozen tax allowances and tax bands.
Ways to reduce your income tax bill
There are a few ways in which you can negate the impact that your income tax bill can have. Broadly, they are as follows:
Contribute to your pension
Contributions to a pension are usually made from taxed money (unless in a 'net pay' scheme). However, when you pay in, you will pay the “net” amount (80% for a basic rate taxpayer). The government will then make up the tax paid on the amount contributed, effectively making the contribution itself, tax-free.
For example, if you’re a basic rate taxpayer you can receive tax relief of 20% from the government, therefore it costs you 80p to make a £1 pension contribution.
Contribute to your pension via salary sacrifice
You can ask your employer to enter into a salary sacrifice contribution arrangement to your pension, which will reduce the amount of money subjected to the highest rate of income tax (or various rates depending on the tax bands the income falls into after the sacrifice), along with also providing valuable National Insurance savings. This can become quite complicated, and more details can be found on the government website.
A notable additional benefit of salary sacrifice arrangements is that depending on your employer, they may pay the National Insurance Contributions savings they make from the forgone salary into your pension.
Make full use of your annual allowance
The great news is the Government have increased the amount that you can contribute into a pension each year, without suffering a tax charge. The maximum annual allowance has risen from £40,000 to £60,000, implemented at the beginning of the 2023/24 tax year.
If you are not subject to tapering of your annual allowance and you have not utilised your full allowance of £60,000, then you could consider making use of the full allowance from a personal contribution, or carrying-forward unused annual allowance from previous years. Please note, however, this can only be done up to a maximum of the three previous tax years and personal tax-relievable contributions are capped at 100% relevant UK earnings regardless of the amount of unused annual allowance.
Up to 60% tax relief available when you invest in a Pension
Investing in your pension pot is an attractive option to increase your savings in a tax efficient way. We actively encourage clients, when suitable, to contribute regular amounts to their pension to not only build up their pension pot but also to benefit from tax efficiencies.
For those earning between £100,000 and £125,140 you could be in the 60% tax trap. But this also presents an opportunity when it comes to saving for retirement. If you have taxable income in this range, you can effectively receive income tax relief of 60% on your pension contributions as this is the marginal rate of tax paid on earnings within this band. This is due to the impact of your personal tax allowance of £12,570 being reduced by £1 for every £2 you earn over £100,000 meaning the allowance is reduced to zero when your income reaches £125,140. A pension contribution within this band of earnings effectively reclaims part, or all, of your personal allowance thus increasing the rate of tax relief to 60%.
How to avoid the High Income Child Benefit Charge
An individual can receive Child Benefit if they are responsible for raising a child who is either under 16 or under 20 if they stay in approved education or training. There are two rates at which it is paid; for the first/eldest child, you will receive £25.60 per week and for any additional children, you will receive £16.95 per week per child.
If you are a couple claiming Child Benefit, where one or both individuals have an income above £60,000 per annum, or someone else claims Child Benefit for a child living with you and they contribute at least an equal amount towards the child’s upkeep, you may have to pay a tax charge. This is known as the ‘High Income Child Benefit Charge’.
The tax charge is calculated through the tax return on any partner whose income is more than £60,000 a year. In the event that both partners have incomes over £60,000, the charge will apply to the partner with the higher income. The tax charge will be one percent of the amount of Child Benefit received for every £200 of excess income, meaning that the Child Benefit is completely removed when income reaches £80,000.
One way you may avoid the tax charge is if a personal pension contribution is made, as the adjusted net income used by HMRC will reduce. If the contribution is enough to reduce this to below £60,000, the High Income Child Benefit tax charge will be avoided.
The benefits of charitable giving
Giving to charity is not only good for the cause receiving your donations but is also beneficial to your annual tax bill. If you keep a record of your donations, you will be entitled to report these on your tax return.
The most common way to donate to a UK registered charity or community amateur sport clubs (CASCs) is through Gift Aid. Gift Aid can only be claimed by UK taxpayers and is effectively the repayment of basic rate tax on the donation. This is not repaid to the donor but is given to the charity as they can claim an additional 25p for every £1 they receive.
If you are a higher (40%) or additional rate (45%) taxpayer, you are able to claim the difference between your tax rate and the basic rate of tax (20%) on your total charitable donation. An example of this is shown below:
If you make a charitable gift of £100, the charity will be able to receive £25 from HMRC to reclaim the basic rate tax. As a higher/additional rate taxpayer, you can then claim a further £25 (higher) or £31.25 (additional) relief back via your self-assessment for the £125 (gross) contribution you originally made. To do this, you must register for gift aid with a ‘Gift Aid Declaration’, keep a record of your gifts and gift no more than four times your total income and capital gains tax payment for the tax year in question. More information can be found here.
And not forgetting, charitable giving is a great way to lower your loved one's inheritance tax bill.
Tax relief schemes and other allowances
An investment into a qualifying Venture Capital Trust (VCT), Enterprise Investment Scheme (EIS) or Seed Enterprise Investment Scheme (SEIS) attracts significant tax benefits. For an EIS or VCT, you can receive 30% income tax relief on the amount you invest, for SEIS this increases to 50% relief. This 30% or 50% is only achievable if you have paid sufficient tax for the year in question. For example, if you invested £200,000 into a VCT, you would receive £60,000 tax relief if you had an income tax bill of at least £60,000.
These investments were created by the government, as an initiative designed to help small and medium sized companies raise finance by offering tax benefits to investors. Given the type of companies they invest in, they are perceived to be high-risk investments.
They can be attractive to those who have maximised their other allowances for the tax year and are earning a significant salary which takes them into the higher and additional rate tax band.
But, as higher risk investments they are not suitable for all investors. There is a chance that all of your capital could be at risk and you should not invest into these types of plans without seeking expert advice from a reputable firm of independent advisers such as The Private Office.
|
Don’t invest unless you’re prepared to lose all the money you invest. This is a high-risk investment and you are unlikely to be protected if something goes wrong. |
|---|
How we can help
There are a number of actions that can be taken to reduce the amount of income tax you pay, which are especially beneficial if you fall into the higher or additional rate tax bands. These tax efficiencies are built into our financial plans, and we actively help clients maximise their allowances and income so they can achieve their goals throughout their lives. If you would like to find out more about how The Private Office can help you with personalised tax efficient financial plans, please enquire for a free initial consultation with one of our Independent Financial Advisers.
Arrange your free initial consultation
The information contained within this article is based on our understanding of legislation, whether proposed or in force, and market practice at the time of writing. Levels, bases and reliefs from taxation may be subject to change.
The content in this article is for information only and does not constitute individual financial advice.
A pension is a long term investment, the value of investments can fall as well as rise. You may not get back what you invest.
Your eventual income may depend on the size of the fund at retirement, future interest rates and tax legislation.
The Financial Conduct Authority (FCA) does not regulate tax planning or advice.
VCTs are high risk investments and there may be no market for the shares should you wish to dispose of them. You may lose your capital.

Nine ‘finfluencers’ charged in FCA crackdown
The financial industry regulator, the Financial Conduct Authority (FCA), has charged nine ‘finfluencers’ – individuals that give unlicensed financial advice on social media – in a crackdown on financial misinformation and exploitation, which can be rampant on social media platforms.
One of the nine, Emmanuel Nwanze, was charged with running an unauthorised investment scheme and issuing unauthorised financial promotions. The FCA alleges that, between 19 May 2018 and 13 April 2021, Nwanze used an Instagram account to provide advice on buying and selling Contracts For Difference (CFDs) when they were not authorised to do so. CFDs are well known for being high-risk investment products that are used to bet on the price of an asset.
The FCA is intent on making an example out of the nine to discourage further unregulated advice of this nature.
Six of the defendants appeared before Westminster Magistrates Court on 13 June 2024. A further three with appear before the court on the 3 July.
What is a ‘finfluencer’?
Finfluencer is a relatively new term, used to describe a content creator who operates on social media to promote financial products and services to their audience. What separates a finfluencer’s advice from regulated financial advice is the finfluencer is often unqualified, unauthorised and unregulated. This means that it is common for them to promote risky investments, with no understanding of the consequences, often to the detriment of their audience and pure financial gain to them.
Finfluencer derives from the term ‘influencer’ which, in marketing and social media terms, refers to a person with the ability to influence viewer’s opinions on social media or video sharing platforms like YouTube.
The problem with finfluencers
If an finfluencer is knowledgeable about the product or service they promote and their content is considered 'responsible' by the FCA, finfluencers can actually be beneficial. They help buyers evaluate their choices and understand the variety of products available to them in a simple and easy to digest way.
The problem is that there are many examples like the nine that have been charged by the FCA, where this is not the case. Many finfluencers promote illegitimate 'get rich quick' schemes or act irresponsibly in their communications, with endorsement of questionable crypto investments and ‘memestocks’ being a common trend. In such cases, less knowledgeable audience members get exploited and even scammed.
Aside from the obvious detriment to the victims of this kind of unlicensed advice, the wider reaching implications is that this misinformation leads to a general distrust of the financial services industry, further discouraging financial literary and ultimately hurting the consumer.
If you are concerned about possible misinformation and are seeking real, impartial and fully qualified financial advice, book a free non-committal initial consultation with one of our qualified advisers who will be happy to see if we can help. Alternatively, you can give us a call on 0333 323 9065 to get in touch with a member of our team to find out more.
Arrange your free initial consultation
This article is intended for general information only, it does not constitute individual advice and should not be used to inform financial decisions.
Investment returns are not guaranteed, and you may get back less than you originally invested.

Ups, Downs and Elections – it’s a summertime roller coaster for investors
This month’s TPO Investment Market Update looks at how markets have developed since last month’s update, reiterating the benefits of portfolio diversification. The drivers of the top 3 performing major equity indices are looked at in more detail and we discuss the recent and upcoming elections globally and the impact of these on markets.
Arrange your free initial consultation
In last month’s update we discussed the benefit of holding a regionally diversified portfolio, given the reversal of return patterns between Q1 and April i.e. UK and Chinese equities outperformed, having lagged behind in Q1. We are now two thirds of the way into Q2 so for this month’s edition let’s see how markets have developed. We will also touch on the political environment, focussing on elections happening across the globe.
Market returns and the benefit of diversification
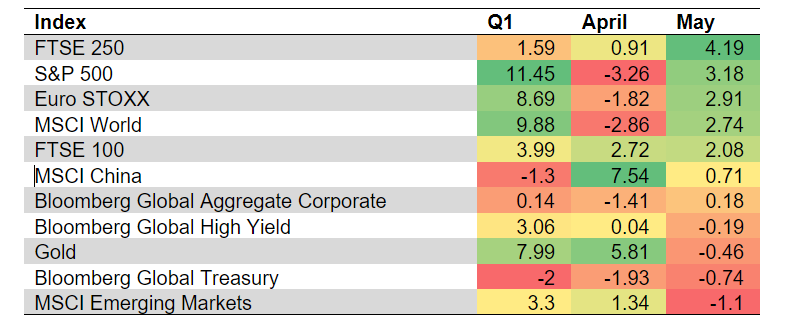 Figure 1 – Major equity & fixed income index returns – Source: FE Analytics, 2024.
May again proved the benefit of not concentrating your portfolio in just one or two assets. The S&P 500, which tracks the US stock market, was the second-best performer, having been amongst the worst in April. The FTSE 250, which tracks medium sized UK companies, was the best performer in May, having been towards the bottom in April and Q1. On the other end, gold, which had been the second-best performer in April was towards the bottom in May. Unless you have a crystal ball, it therefore pays to split your eggs amongst many baskets.
US Markets
Having reiterated the benefit of diversification, lets dive into the most notable drivers of returns in May, starting with the world’s largest equity market, the United States. Returns in the US have become increasingly dominated by only a handful of companies, to a degree that is unprecedented in recent memory. The chart below shows the top 10 companies’ share of total S&P 500 market capitalization, and the table shows the specific companies.
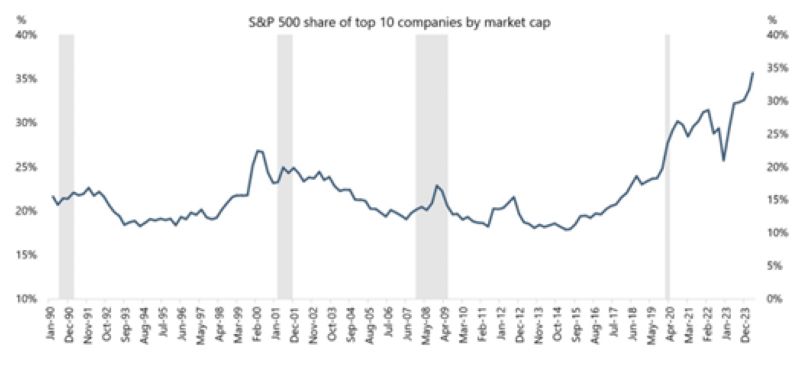
Figure 2 – Top 10 companies share of S&P 500 market capitalization – Source: Yahoo Finance, 2024.
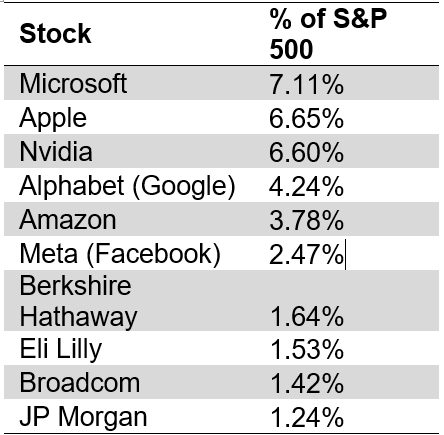
Figure 3 – Top 10 S&P 500 companies by market capitalization – Source: Slickcharts, 2024.
It is striking that the top 6, along with Broadcom, are all semi-monopoly technology companies. The dominant market positions they have achieved allow them to rake in large and growing profits and build up significant cash buffers. Investors have therefore piled into these stocks due to their superior profit growth, along with the safety afforded by their large cash piles. US investor sentiment is such that investors are willing to take risk and buy up on equities, but are still somewhat worried about a slowdown in economic growth, and so are averse to taking the risks associated with owning stocks more exposed to the business cycle and with smaller cash buffers.
European Markets
European equities have had a similarly good month. This came on the back of two primary causes, the first being a better-than-expected earnings season (in which 288 of 600 companies have so far reported their Q1 earnings), and the second being the expectation during May that the ECB would cut interest rates in June, which they now have. Looking at the first of those causes, the chart below shows by how much reported earnings beat market expectations by sector.
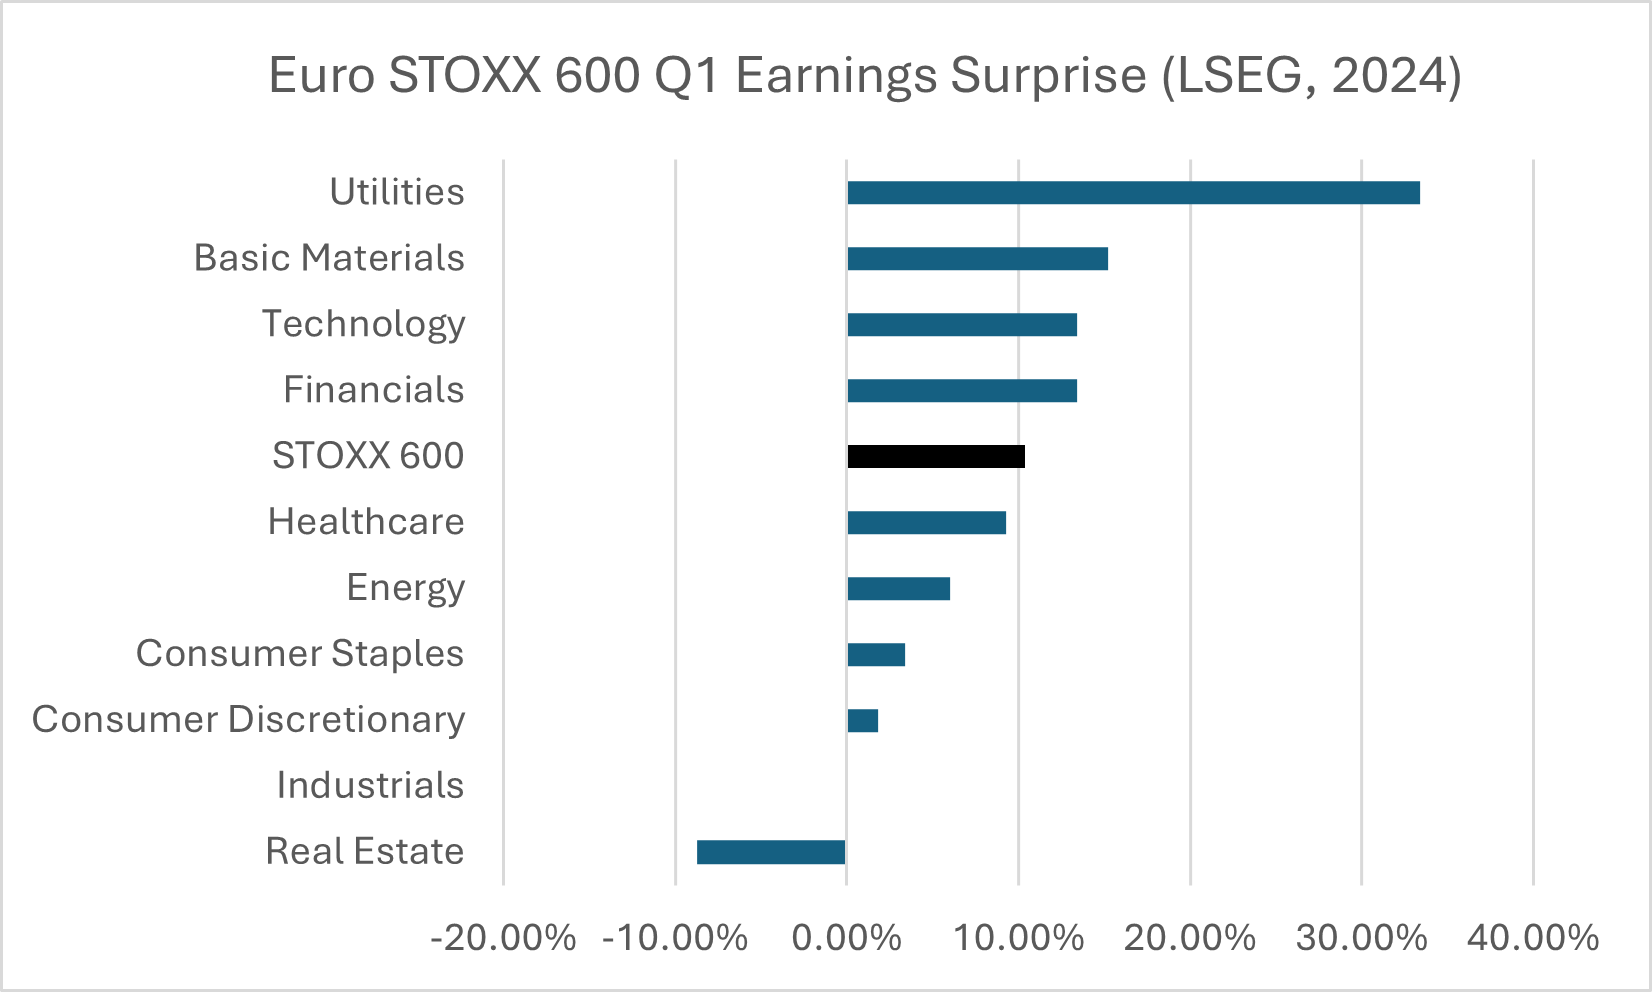 Figure 4 – STOXX 600 Q1 sectoral earnings surprise – Source: LSEG, 2024.
Across the whole market, European companies have beaten expectations by 10%, with only industrials and real estate underperforming expectations.
The second cause for European equity strength was the expectation of an ECB rate cut in June. Inflation has been falling in Europe and has got close to the 2% target, allowing the ECB to make an initial rate cut. This is in the context of a German economy still struggling with the effects of high energy prices, due to the Ukraine war, and increased export competition from China.
UK Markets
The final market that’s worth covering before we touch on elections is the FTSE 250, an index measuring the performance of mid-sized UK companies. The chart below shows the valuation of the FTSE 250 (dark blue line) versus mid-sized companies in other developed markets. The valuation metric used is Price-to-Earnings (P/E), which describes how many pounds you pay in stock price for a pound of company profits.
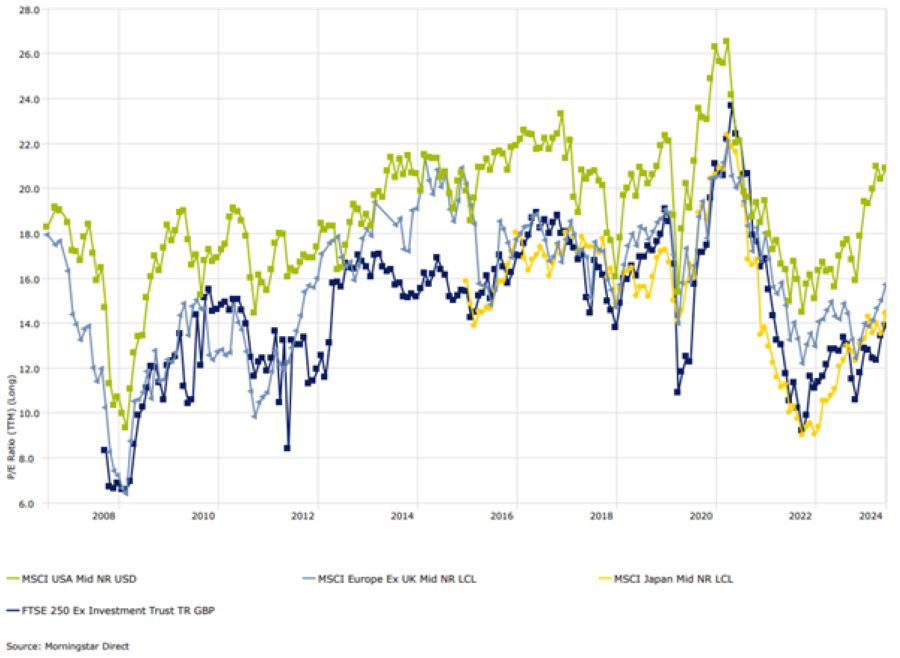
Figure 5 – P/E ratio of mid-cap indices in major developed markets – Source: Morningstar, 2024.
For mid-sized US companies, you are paying £20 for every £1 of company profits, whereas in the UK you only pay £14 for every £1 of company profits. While the US has long traded at a premium, this gap is wider than the long-term average and represents good value to international investors looking for a bargain. Where we have seen the most interest has been from large companies and private equity investors looking to purchase whole companies – recent examples include the £5bn private equity bid for Hargreaves Lansdown and American Industrial Partners £2.5bn bid for Serco. As this inbound merger and acquisition activity has increased, investors have bid up shares they think could be a future takeover target.
Elections
It has been a busy month for elections, with European, Mexican and Indian elections all taking place already, UK and French elections being called, and US election campaigning getting started.
Indian and European elections both caused volatility in their respective markets. Indian equities fell around 8% and then quickly regained that upon Modi’s win. In Europe, the surprise victory of the Le Pen’s National Rally in France during the European Parliamentary elections caused jitters in bond and currency markets. UK and European elections are yet to cause significant volatility but it is expected closer to voting.
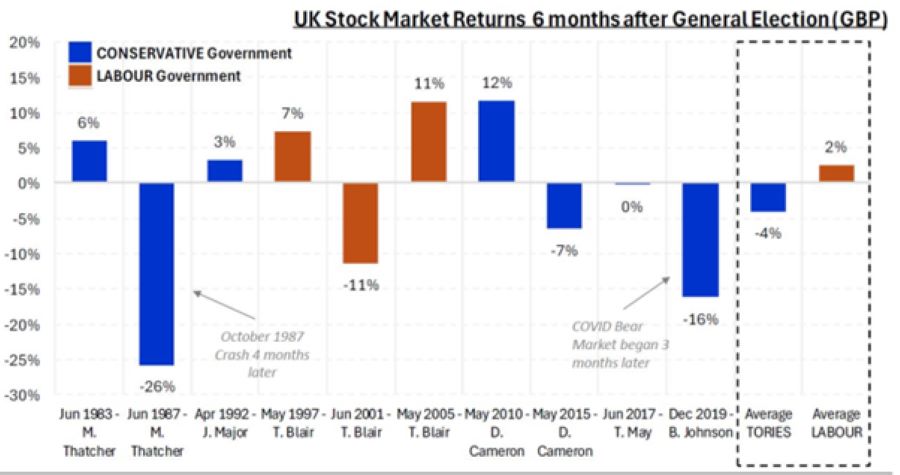
Figure 6 – UK stock market returns 6m after elections – Source: FE Analytics, 2024.
Average returns following a Labour victory, which is expected this election, have been better than under Conservative victories, although this number is distorted by the 1987 and ‘covid’ market crashes. From speaking to fund managers and allocators in the City, most are broadly welcoming of the stability expected under Starmer and Reeves, so the election should be supportive of equity returns.
Conclusion
In conclusion, equity markets continue to move upwards and make all-time highs, despite the bumps in the road felt during April. While performance has varied between regional markets from month to month, reinforcing the value of a diversified portfolio, the general trend is upwards. Political instability, primarily caused by elections, has, and will increase the volatility of markets, however the historical data, at least in the UK, points to the election being supportive of equity returns.
If you have any questions about your portfolio please don’t hesitate to contact your adviser.
Arrange your free initial consultation
This market update is for general information only, does not constitute individual advice and should not be used to inform financial decisions.
Past performance is not a guide to future returns. Investment returns are not guaranteed, and you may get back less than you originally invested.

The new rules around sustainable investing
Environmental, Social, and Governance (ESG) investing refers to an investor's desire to invest not only for financial gain but also to have a positive impact on the environment, ensuring that a company has a positive impact on society while adhering to strong governance standards.
The term ‘ESG investing’ has also been used interchangeably to describe ethical investing which is to invest in line with one’s own belief system, and impact investing which is to invest for both a financial goal and a specific environmental or social outcome.
The history of ESG investing
You might think that ESG investing is a relatively new concept, but we can go back to the early 1950s with Howard Bowen's book "Social Responsibilities of the Businessman," in which he articulated that businesses have a moral obligation to serve not only their customers, but also the society in which they operate (and thrive). The UN's "Who Cares Wins" report in 2004 was another watershed moment in which the term 'ESG' was formally introduced into our common language. It served as the foundation for the launch of the UN Principles for Responsible Investment (PRI) in 2006, which encouraged the incorporation and adoption of ESG values into an investor's decision-making processes.
Demand for ESG products still exists
Fast forward to the present day, and while there have been additional (welcome) developments in the regulation and formalisation of ESG investing, there has also been a notable alignment of economic and social goals.
Some notable examples include the strong emphasis from governments to adopt clean energy policies and labour policies across the western world, coming under further scrutiny with the ‘fair pay for fair work’ campaign.
This demand for ESG products is only likely to accelerate with further need for companies to adopt sustainable business practises.
Greenwashing & the number of ESG funds
Due to this rising consumer demand, the market has seen an increase in the number of financial products and services that claim sustainability features. However, this has increased the risk of greenwashing, in which companies' sustainability claims are exaggerated, misleading, or unsubstantiated.
Between 2021 and 2023, the FCA received over 1,700 applications to launch a new ESG or sustainability-focused fund (Source: Morningstar). This prompted the FCA to state that:
“We have seen numerous applications for authorisation of investment funds with an ESG or sustainability focus. A number of these have been poorly drafted and have fallen below our expectations. They often contain claims that do not bear scrutiny.” (July 2021).
What are Sustainability Disclosure Requirements?
In response, the FCA has introduced the Sustainability Disclosure Requirements, also known as 'SDR', with the goal of protecting consumers and ensuring a fair marketplace, published 28/11/2023.
The SDR are multifaceted, but the overarching goal is to assist consumers in making informed decisions based on their sustainability preferences, while also promoting fairness among firms that provide genuinely sustainable products and services.
The anti-greenwashing rule
The SDR introduces a new rule that requires all regulated firms, ensure that any sustainability-related marketing claims are clear, fair, and not misleading, as well as consistent with the product's sustainability profile. There are also limits on the use of sustainable terms in product names and marketing.
What is happening to the term ‘ESG Investing’?
To date, a fund could be marketed as 'ESG', 'Sustainable' or a range of other green descriptives with little oversight, however, the SDR has implemented a new fund labelling system with prescriptive guidelines on how funds can be marketed.
From 31st July 2024, fund managers can begin to use one of four labels which, whilst not meant to be hierarchical (an investor can choose a fund which aligns with their preference), will allow investors to identify suitable products and make comparison between funds far easier.
The four labels include:
| Label | Sustainable objective |
|---|---|
| Sustainability Focus | To invest in assets that are environmentally and/or socially sustainable determined by a robust evidence-based standard of sustainability |
| Sustainability Improvers | To invest in assets that have the potential to improve their environmental and/or social sustainability over time, determined by their potential to meet a robust, evidence-based standard of sustainability over time (this is required to be an absolute measure) |
| Sustainability Impact | To achieve a predefined, positive, measurable impact in relation to an environmental and/or social impact |
| Sustainability Mixed Goals | To invest in two or more of the above sustainability objectives |
To use a label a fund must have at least 70% of its assets in alignment with one of the above sustainability objectives. It remains to be seen how many funds will apply for a label but estimates from Morningstar are that 300 existing funds will seek a label.
It should be noted that the SDR applies only to UK domiciled funds this is unlike the SFDR (the European Commission’s approach to regulating ESG funds) which applies to funds globally if they are marketed in Europe.
These labels can be accompanied by the following images:

Source: FCA's Policy statement PS23/16
If you would like more information, why not arrange an initial free consultation with a financial adviser today?
Arrange your free initial consultation
This article is intended for general information only, it does not constitute individual advice and should not be used to inform financial decisions.
Investment returns are not guaranteed, and you may get back less than you originally invested.
Past performance is not a guide to future returns.
The Financial Conduct Authority (FCA) does not regulate cash flow planning or tax advice.

Diversify or die - the case for balanced investor portfolios
In our Investment Markets update this month, we’re going to cover the following 2 themes:
-
How April 2024 contrasted to Q1, leading to the benefits of diversification.
-
The impact of the change in monetary policy expectations in April and how this drove returns.
Arrange your free initial consultation
Market Volatility and Investor Sentiment
Markets are fickle and are prone to reversing their trends at the drop of a hat. The fundamental forces that underpin them are usually slow moving, but investors animal spirits aren’t easily tamed. They can bolt like a wild beast in response to small disturbances, in the form of economic data releases that don’t conform to expectations. This was the case in April, when markets took slowing US economic growth and sticky inflation data poorly, causing a stampede to exit many of the main regional equity and fixed income markets. That said, there were some regions that maintained their sense of calm and even excelled – reinforcing the value of holding a portfolio diversified across geographies.
Q1 Market Performance
To frame this story we’d like to show you how markets behaved from January to March. The table below provides a brief summary.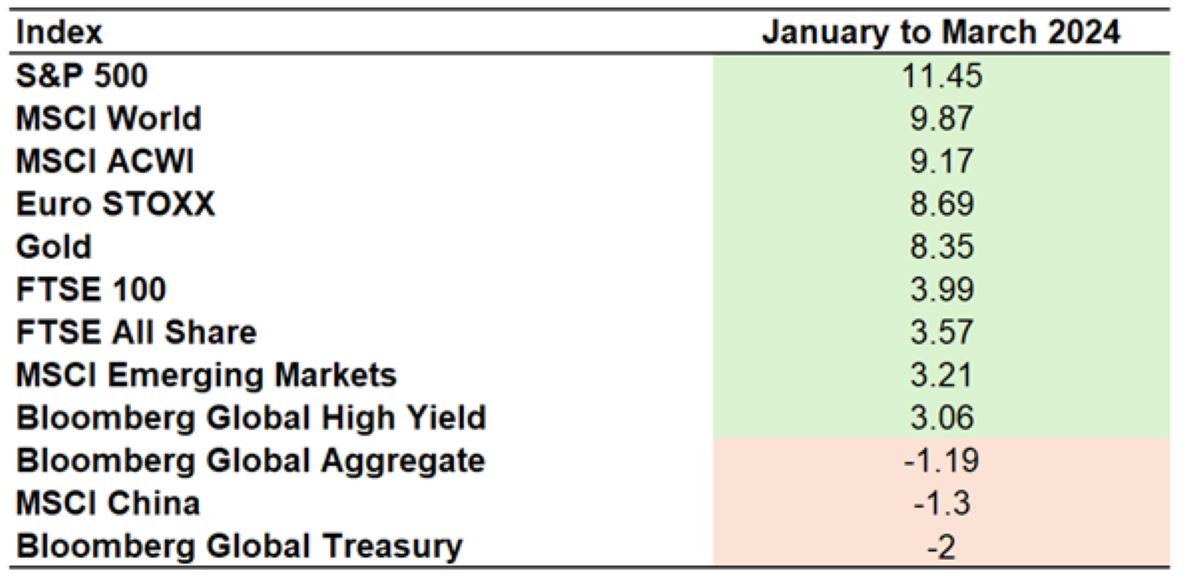 Figure 1 – Table of returns to key global asset classes – Source: FE Analytics, 2024.
US equities, in the form of the S&P 500 index, led the pack and drove global equity returns, represented by the MSCI World and ACWI indices. UK equities, in the form of the FTSE 100 and FTSE All Share indices, posted respectable performance, however lagged their European and US peers. Chinese equities were in the doldrums, pulled down by negative investor sentiment engendered by a deflating property bubble and the overhang of geopolitical tensions. In a few words: the US excelled, the UK did OK, and China saw serious underperformance.
April's Market Reaction
So what happened in April? US inflation and growth data disappointed investors relative to their expectations. Firstly, economic growth slowed, taking some initial wind out of the sails of US equities, but didn’t slow enough to force the Federal Reserve into signalling interest rate cuts. Secondly, US inflation remained more sticky than investors had hoped, with that last mile down to the 2% target being frustratingly elusive. The inability for inflation to make that final leap below 2% caused much consternation among investors, who removed between 1 and 2 expected interest rate cuts from their pricing of bond yields, causing bond yields to rise and subsequently equity prices to fall. US markets, in the main, drive global markets so this trend spread across most developed markets.
Interest Rate Expectations
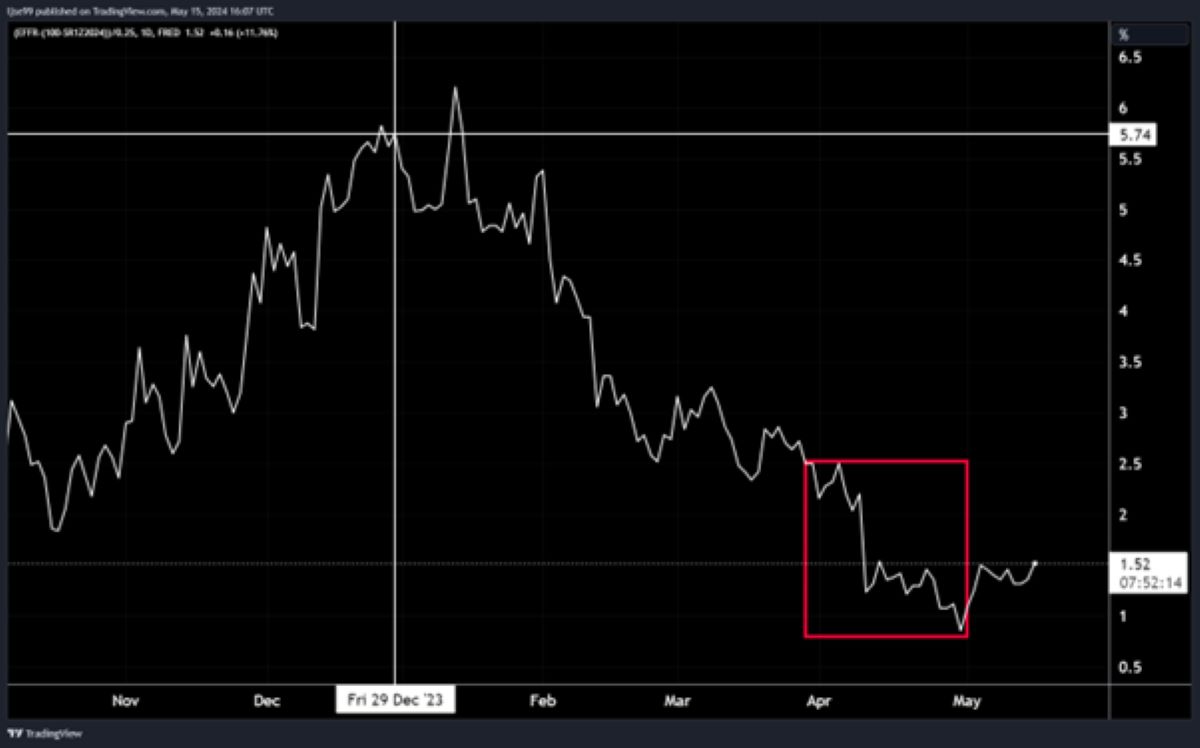 Figure 2 – Number of Federal Reserve interest rate cuts by the end of 2024 expected by markets – Source: TradingView, 2024.
The chart above illustrates the rollercoaster of interest rate expectations through the year. Markets expected nearly 6 interest rate cuts in 2024 at the start of 2024. By the beginning of April this was down to 2.5 cuts and by the end of April, following US GDP and inflation data, this was down further to only 1 interest rate cut. That final move has been boxed in red. This is a return of the so called ‘higher for longer’ interest rate narrative.
Resilience of Diversified Portfolios
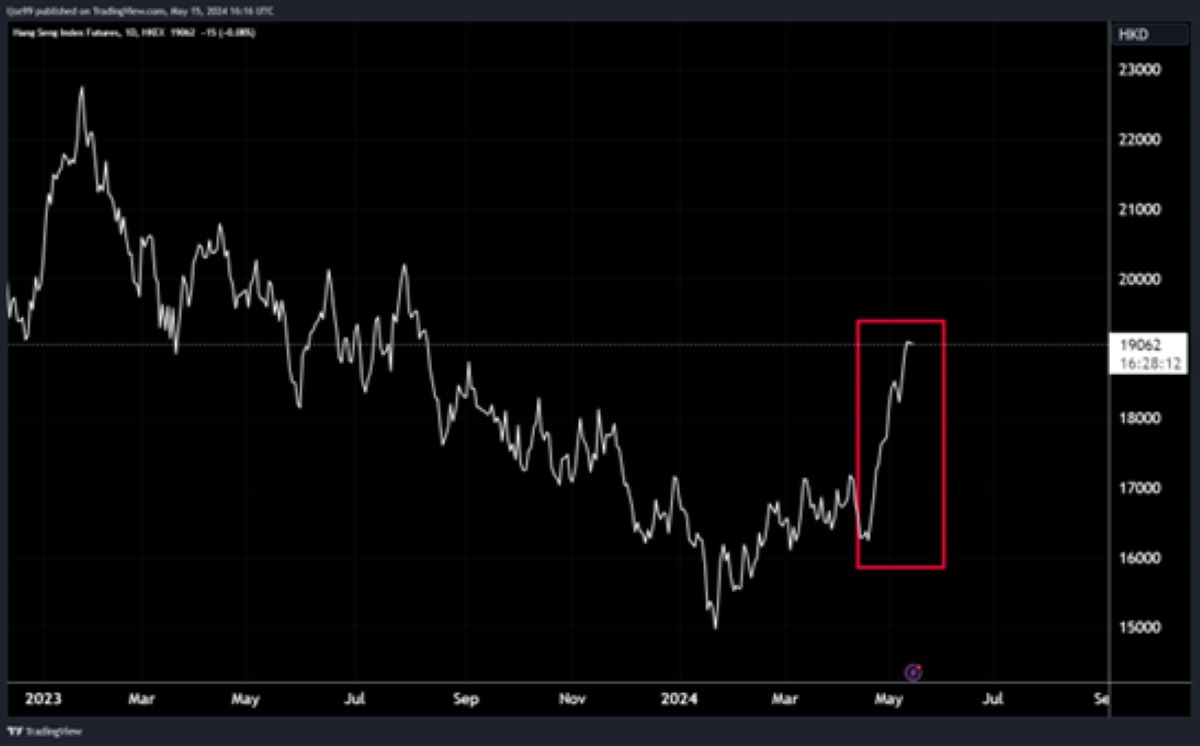 Figure 3 – Hang Seng equity index returns 2023 to date, with recent upwards thrust boxed in red – Source: TradingView, 2024.
However, all was not lost, especially for investors with a diversified portfolio. Chinese equities finally made their comeback, following a year of brutal drawdowns – Chinese authorities had engineered a small reversal in price slides through numerous measures (some as extreme as banning onshore fund managers from selling) and this initial price action drew in western investors who had sat on the side lines for the last year. As western investors returned, prices surged upwards , shown in the Figure 3
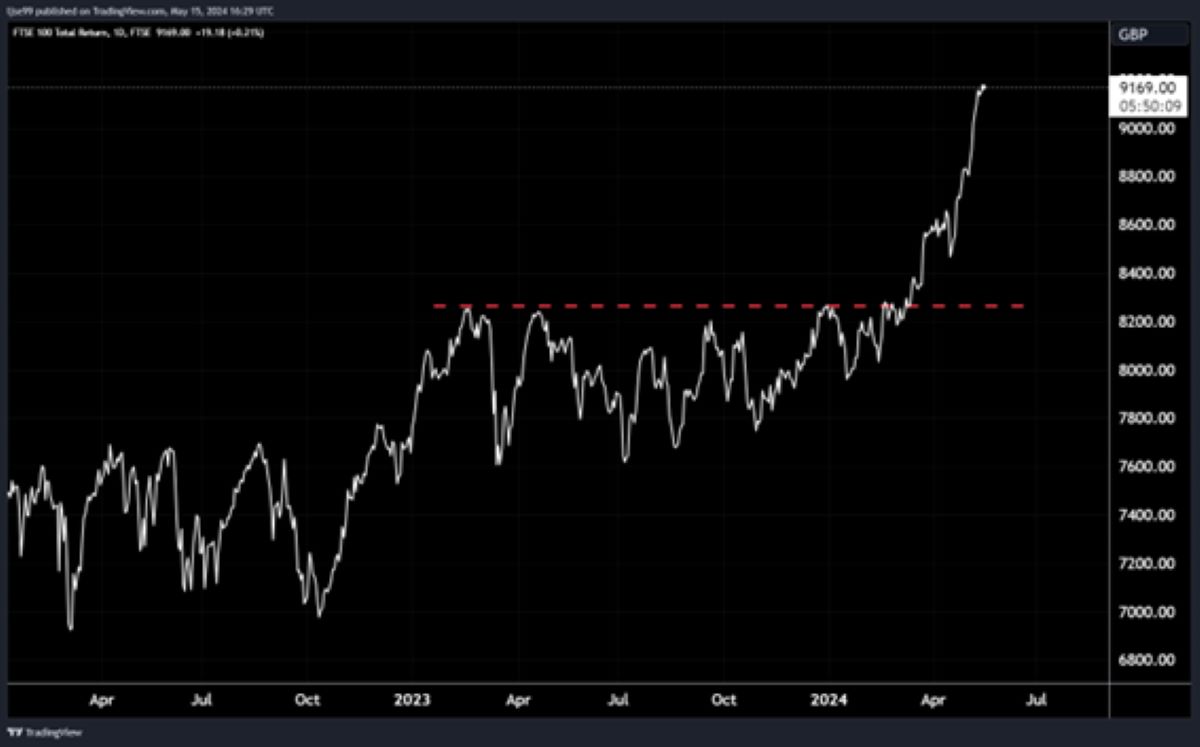 Figure 4 – FTSE 100 Total Returns – Source: TradingView, 2024.
Potentially more relevant to readers in the UK was the performance of UK markets, which broke out from the cage they had been trapped in for 2023 and the start of 2024. The UK has a very different sector composition to US markets: where the US is heavy on high growth technology stocks, the UK has more of the older world industries which have underperformed over the long run but are well suited to periods of rising interest rates and elevated commodity prices (which remain high due to geopolitical tensions).
| Pre-tax profit | |
|---|---|
| Financials | 27% |
| Oil & Gas | 20% |
| Consumer Staples | 13% |
| Mining | 11% |
| Consumer Discretionary | 8% |
| Health Care | 8% |
| Industrial goods & services | 7% |
| Utilities | 3% |
| Telecoms | 2% |
| Real estate | 1% |
| Technology | 0% |
Figure 5 – Sectoral pre-tax profit share of the FTSE 100 – Source: Investor Chronicle, 2024.
The table in Figure 5 shows the sectoral share of FTSE 100 profits. Notable is the high share of financials (mainly banks) and energy and mining companies. Banks benefit from interest rates remaining higher for longer because it extends the period in which they can offer loans at high interest rates, increasing their margins and benefitting their profitability. Energy and mining companies benefitted from elevated commodity prices, which have seen an uplift as geopolitical tensions raise questions over security of supply.
Conclusion
In conclusion, markets at the highest level performed well from January to March, but took a tumble in April as slowing US economic growth and sticky US inflation caused investors to worry about the future path of interest rates – but this pain was not evenly spread, with some of the initial laggards becoming the best performers. This recent experience reinforces the need for a portfolio that is diversified across geographies, economic sectors and asset classes.
If you have any questions about your portfolio please don’t hesitate to contact your adviser.
Arrange your free initial consultation
This market update is for general information only, does not constitute individual advice and should not be used to inform financial decisions.
Past performance is not a guide to future returns. Investment returns are not guaranteed, and you may get back less than you originally invested.

The investment crystal ball - What do we know so far?
With the first quarter of the year already wrapped up (it feels like Christmas was yesterday!) we thought it would be worth recapping the high-level macroeconomic picture and summarising the notable movements in markets through the quarter. We start with economic growth below.
Arrange your free initial consultation
Macroeconomics - Economic Growth & Inflation

Figure 1 – When do economists think the next US recession will occur?, Source: DeutcheBank, 2024.
Before we dig into the current macroeconomic landscape it’s worth setting the scene by revisiting how macroeconomists expected the economy to perform both in 2023 and 2024’s first quarter. The chart above shows the percentages of economists that expect a US recession in given time periods, surveyed every quarter. Throughout 2023 the date of recession was pushed back ever further, from ‘later in the year’ out to ‘2024’. Now that we have arrived in 2024 expectations have moved out into 2025 and beyond. But why is this?
The most consequential data release was the Q4 2023 GDP data for the US, which surprised economists and investors, growing at an annualized rate of 3.4% . This has been reinforced by labour market data showing that hiring and wage growth remains strong, with the expectation that this will continue to support household consumption through 2024. The OECD now estimate the US economy to grow 1.5% in 2024, a far sight from the recession expected last year.
Economic growth outside of the US has been more sluggish, particularly in developed markets. Higher debt burdens in Europe have held governments back from the level of government investment seen in the US, while developed Asian economies are yet to see the full benefits of Chinese stimulus efforts. The OECD’s forecasts of economic growth in 2024 and 2025 for G20 economies can be seen below:

Figure 2 – GDP Growth projections for G20 and OECD countries, Source: OECD, 2024.

Figure 3 – US Inflation from 2020 – 2024, Source: Bureau of Economic Analysis, 2024.
The chart above shows the US inflation rate from 2020 through to the latest data release for February 2024. The orange line shows year-on-year inflation, while the blue line shows the inflation in a given month at an annualised rate, i.e. showing what the inflation rate would be for a whole year if it stayed at the pace of that month. Inflation data is fairly volatile from month to month, so the year-on-year figures are important in establishing trends, while the monthly data is useful in spotting where those trends may be changing course.
Two things stand out in the graph. Firstly, there has been a clear downward trend in inflation since July of last year. This has supported the Federal Reserve in guiding markets towards interest rate cuts in 2024. Secondly, inflation in the first two months of this year has accelerated above the year-on-year rate, running at an annualised rate of 4-4.5%. This second point has caused consternation among investors, who are becoming less certain that central banks will be able to cut interest rates in the first half of this year.
Markets – Fixed Income
That final point leads into the market performance of fixed income securities.
The price of a bond is inverse to the yield it pays, meaning rising bond yields cause falling bond prices (and thus capital values) and vice versa. As interest rate cut expectations are pushed further into the future and become less probable, the yield on bonds rises. This effect, of changes in interest rates and their expected future path on bond prices is called ‘duration risk’, and the effects of this risk are greater when a bond’s maturity is longer and the coupon (yield) it pays is smaller. Government bonds tend to have longer maturities, and owing to their security, tend to pay a smaller coupon (yield), making them highly susceptible to changes in interest rate expectations. At the other end of the spectrum, you find high yield corporate bonds, which tend to have a short maturity, and owing to their lower credit quality (i.e. higher credit risk) they pay a higher coupon. Thus, government bonds are more exposed to duration risk, high yield corporate bonds are more exposed to credit risk, and investment grade corporate bonds tend to sit in the middle on both risks.

Figure 4 – High Yield, Investment Grade and Government Bond returns in Q1 2024, Source: FE Analytics, 2024.
The first quarter saw high yield corporate bonds (grey line) outperform both investment grade corporate bonds (purple line) and government bonds (turquoise line). Going back to the macroeconomics, we had strong economic growth and some signs of inflation ticking up, meaning economic growth can sustain corporate cashflows and stave off credit risks, while inflation worries cause interest rate expectations to rise and thus longer duration bonds to selloff. Investment grade corporate bonds and government bonds were those longer duration bonds that sold off.
Markets – Equities

Figure 5 – Regional Equity Market Returns in Q1 2024, Source: FE Analytics, 2024.
Equity markets shrugged off the losses in government bonds and posted a strong quarter, with China being the only major region to see losses – a deflating property sector continues to weigh on corporate investment and household consumption. The strongest performance on a country basis was seen in Japan, propelled by a combination of robust corporate profit growth and favourable international investor sentiment. An interesting picture emerges when equity returns are broken down by sector, shown below.
Leading contributors
Time period: 01/01/2024 to 31/03/2024
| Rescaled weight | Return | Contribution | |
| Semiconductors | 7.28 | 34.53 | 2.32 |
| Software | 10.03 | 9.83 | 0.96 |
| Banks | 7.08 | 9.89 | 0.70 |
| Interactive media | 4.81 | 14.64 | 0.70 |
| Retail - Cyclical | 5.31 | 12.46 | 0.65 |
| Insurance | 3.97 | 13.50 | 0.52 |
| Oil & Gas | 4.33 | 10.59 | 0.46 |
| Drug manufacturers | 5.01 | 8.87 | 0.44 |
| Industrial products | 2.47 | 10.94 | 0.27 |
| Aerospace & defense | 1.56 | 15.64 | 0.24 |
| Credit services | 1,74 | 11.59 | 0.20 |
| Medical devices & Instruments | 2.03 | 9.52 | 0.19 |
| Media - Diversified | 0.99 | 19.57 | 0.18 |
| Retail - Diversified | 1.57 | 10.97 | 0.17 |
| Farm & Heavy construction machinery | 0.74 | 16.96 | 0.12 |
Figure 6 – Sector level contributions to global equity returns in Q1 2024, Source: Morningstar Direct, 2024.
The table above show industries, their weightings in global equity markets, the returns generated by those industries in Q1, and by multiplying their weight and returns shows their contribution to global equity market performance.
AI and semiconductors have driven market performance through 2023 and the first quarter, shown by semiconductors and software ranking top two in sector contribution. What has been interesting is the catchup of many of the ‘cyclical’ sectors that are sensitive to changes in economic conditions, these are the likes of banks, oil and gas producers, discretionary retailers, and industrial product manufacturers. These sectors had been fairly flat for the first two months of the year but staged a comeback in March following the release of data suggesting an upturn in the global manufacturing cycle and inflationary pressures.
Summary
Economic growth has been better than expected so far this year, particularly in the US.
Strong growth has underpinned rising inflation, which has held back government bond performance but supported returns in high yield corporate bonds.
Equity markets have been largely unphased by recent inflation data, with semiconductor and AI related stocks continuing to gain. However, towards the end of the quarter there has been a notable rotation into cyclical stocks that benefit from an economy that is heating up, both in terms of inflation and manufacturing growth.
As a client of either our discretionary or advisory portfolio service, your portfolios are positioned to capture remaining upside in the AI/semiconductor space, while retaining significant allocations to cyclical sectors through UK & European equities. Similarly, we remain vigilant to developments in bond (fixed interest) markets. Our asset class and sector/industry diversification aims to smooth out returns and ensure that our investors benefit from different investment opportunities throughout the economic cycle. If you have any questions about your portfolio please contact your adviser.
Arrange your free initial consultation
This market update is for general information only, does not constitute individual advice and should not be used to inform financial decisions.
Past performance is not a guide to future returns. Investment returns are not guaranteed, and you may get back less than you originally invested.
The question is when rather than if
This month we explore how investors might be rewarded for holding a diversified portfolio and whilst one cannot time the markets the outlook for asset prices remains positive this year.
Arrange your free initial consultation
Global Equity Performance
Last month was another strong month for equity markets with the S&P 500 reaching a record high as earnings for the “Magnificent 7” did not disappoint investors, a (long awaited) rebound in Chinese equities supported broader Asia, the Nikkei index in Japan reached a high not seen since December 1989 and European equities whilst underperforming relative to their US equity peers produced positive returns in the month (see Figure 1.).

Figure 1. World Equity returns, Source: JP Morgan, 29th February 2024
In fixed income we saw positive returns from high yield (a form of riskier corporate debt and less sensitive to interest rate expectations given its low duration) which is no surprise considering the positive return in risk markets such as equities. US and European Government bonds were down in the month as stronger inflation data saw investors push back their expectations of a cut in interest rates, meanwhile continued strength in UK wage data saw the price of Gilts fall as investors also revised their expectations of when the Bank of England will cut interest rates (see Figure 2.).
Figure 2. World Fixed Income returns, Source: JP Morgan, 29th February 2024
Diversification importance
Some of you reading this will have already noted that with equities going up in price and bonds falling in price, it means that the two asset classes exhibited negative correlation and offered investors the opportunity of diversification. That word (diversification) which has eluded investors in recent years as equities and bonds moved in tandem, going up together (most recently in October of last year) and falling together with the most notable example being in January 2022 when Central Banks reopened the quantitative tightening policy playbook and began to hike interest rates from historic lows.
As we move through this year the feature of ‘diversification’ and the idea that having exposure to multiple asset classes and regions is an optimal approach to one’s investment journey is something I expect to continue and will look to substantiate in this update. I’m cognisant though and to plagiarise the widely used quote that “history does not repeat but it rhymes”, it’s not as simple as to suggest simply repeating what was successful last time.
Interest rate expectations
Interest rates are expected to be cut this year as inflation data in the developed world has fallen materially from the highs of 2022. UK inflation in October 2022 was 11.1% and recently came in 4% year on year (which was even below analyst forecasts) and whilst the US - which has been the poster child for the soft-landing narrative - saw its most recent inflation print increase, this was to 3.2% which is a long way from the 9.1% inflation rate that was recorded in June 2022.
This sets the stage for a cut in interest rates which the market is anticipating will occur in Q2 of this year and with it the potential for bonds to reassume their rightful place as a diversifier in portfolios along with offering investors a positive return.
A fall in interest rates will also have implications for other asset classes. Money market funds which have attracted significant flows in recent times and have seen the Assets Under Management (AUM) in US money market funds reach c. $6.5tn (see figure 3.) will see their relative return fall as the interest on the funds is directly linked to the interest rate set by Central Banks. 
Figure 3. Total assets in US Money Market funds, Source: OFR Analysis, 31st January 2024
The question then posed is will the prospect of reinvestment risk (reinvesting one’s income at a lower rate than previously invested) see increased inflows in equity markets as investors look to achieve a higher return.
Research by Schroders showed that since 1928 there have been 22 interest rate cutting cycles in the US and that on average, equities have outperformed cash by 9% in the 12 months after the first cut in interest rates. Bonds have also typically outperformed cash with an average outperformance of 3%.
Regional opportunities
Referring to my earlier point about not repeating exactly what worked previously. Much has been made about the recent performance of the ‘Magnificent 7’ (see figure 4.) and the rich valuation of US equities compared to the broader US equity market. Whilst there are reasons to support the continued outperformance of these companies (high free cash flows, low levels of debt and durable business models) this is not the same as saying that all the other 493 listed companies in the S&P 500 or more broadly non-US equites will underperform.

Figure 4. Performance of the ‘Magnificent 7’, S&P 500 index, S&P 500 equally weighted index last year, Source: OFR Analysis, 31st January 2024
US exceptionalism – the idea that the US economy has better relative growth, more dynamic financial markets and a strong currency – has long been touted as a reason for the continued outperformance of the US equity market and whilst this is certainly one reason, there are a number of reasons to think we may see this exceptionalism wane at least in the short term.
This is in part due to the fact that the market is pricing in a soft landing in the US and that the Federal Reserve has been able to implement the ‘perfect policy’ (I remain sceptical) but also that investors remain pessimistic on the outlook for other regions.
Leading economic indicators in Europe are beginning to trend up, global factory activity is increasing, and investors are beginning to reassess their view on equities outside of the US specifically given the divergence of European equities compared to US equities. Another potential opportunity lies in Japan where corporate governance reforms and interventions from the regulator will likely see continued support for Japanese equity markets and there looks to be continued price upside considering that the market trades on a cheaper valuation to its global peers (see Figure 5.). 
Figure 5. Forward Earnings of equity markets, Source: LSEG & Reuters, 23rd February 2024
Conclusion
Putting all of this together suggests that investors will be rewarded for holding a diversified portfolio and whilst one cannot time the markets the outlook for asset prices remains positive this year.
If you would like to speak to your adviser about this, or have any other questions please don’t hesitate to get in touch.
Arrange your free initial consultation
This market update is for general information only, does not constitute individual advice and should not be used to inform financial decisions.
Past performance is not a guide to future returns. Investment returns are not guaranteed, and you may get back less than you originally invested.
