Skip to main content
Ups, Downs and Elections – it’s a summertime roller coaster for investors

This month’s TPO Investment Market Update looks at how markets have developed since last month’s update, reiterating the benefits of portfolio diversification. The drivers of the top 3 performing major equity indices are looked at in more detail and we discuss the recent and upcoming elections globally and the impact of these on markets.
Arrange your free initial consultation
In last month’s update we discussed the benefit of holding a regionally diversified portfolio, given the reversal of return patterns between Q1 and April i.e. UK and Chinese equities outperformed, having lagged behind in Q1. We are now two thirds of the way into Q2 so for this month’s edition let’s see how markets have developed. We will also touch on the political environment, focussing on elections happening across the globe.
Market returns and the benefit of diversification
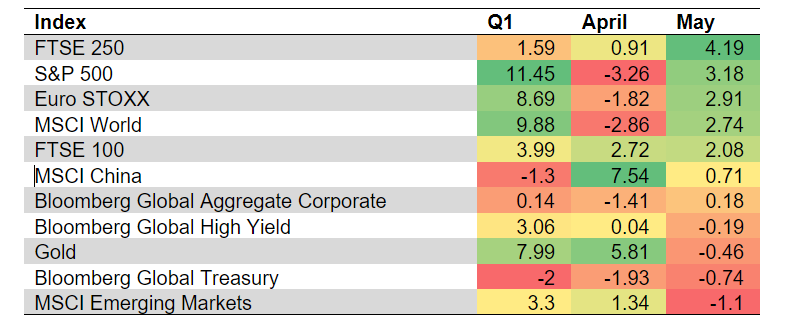 Figure 1 – Major equity & fixed income index returns – Source: FE Analytics, 2024.
May again proved the benefit of not concentrating your portfolio in just one or two assets. The S&P 500, which tracks the US stock market, was the second-best performer, having been amongst the worst in April. The FTSE 250, which tracks medium sized UK companies, was the best performer in May, having been towards the bottom in April and Q1. On the other end, gold, which had been the second-best performer in April was towards the bottom in May. Unless you have a crystal ball, it therefore pays to split your eggs amongst many baskets.
US Markets
Having reiterated the benefit of diversification, lets dive into the most notable drivers of returns in May, starting with the world’s largest equity market, the United States. Returns in the US have become increasingly dominated by only a handful of companies, to a degree that is unprecedented in recent memory. The chart below shows the top 10 companies’ share of total S&P 500 market capitalization, and the table shows the specific companies.
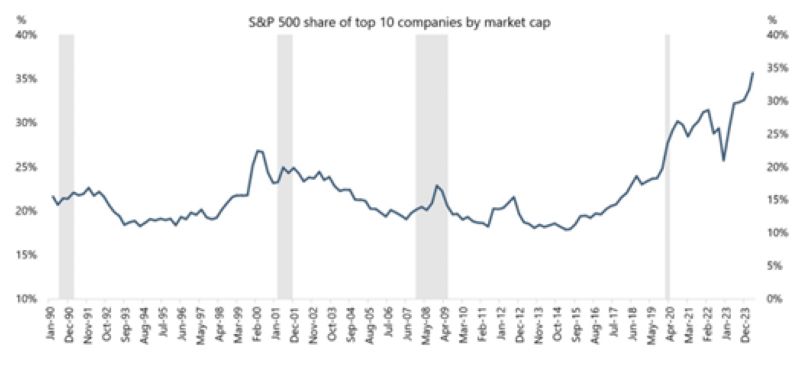
Figure 2 – Top 10 companies share of S&P 500 market capitalization – Source: Yahoo Finance, 2024.
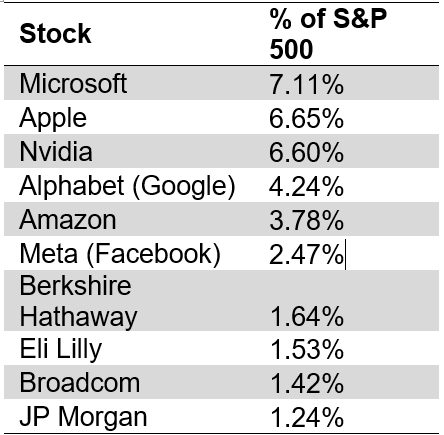
Figure 3 – Top 10 S&P 500 companies by market capitalization – Source: Slickcharts, 2024.
It is striking that the top 6, along with Broadcom, are all semi-monopoly technology companies. The dominant market positions they have achieved allow them to rake in large and growing profits and build up significant cash buffers. Investors have therefore piled into these stocks due to their superior profit growth, along with the safety afforded by their large cash piles. US investor sentiment is such that investors are willing to take risk and buy up on equities, but are still somewhat worried about a slowdown in economic growth, and so are averse to taking the risks associated with owning stocks more exposed to the business cycle and with smaller cash buffers.
European Markets
European equities have had a similarly good month. This came on the back of two primary causes, the first being a better-than-expected earnings season (in which 288 of 600 companies have so far reported their Q1 earnings), and the second being the expectation during May that the ECB would cut interest rates in June, which they now have. Looking at the first of those causes, the chart below shows by how much reported earnings beat market expectations by sector.
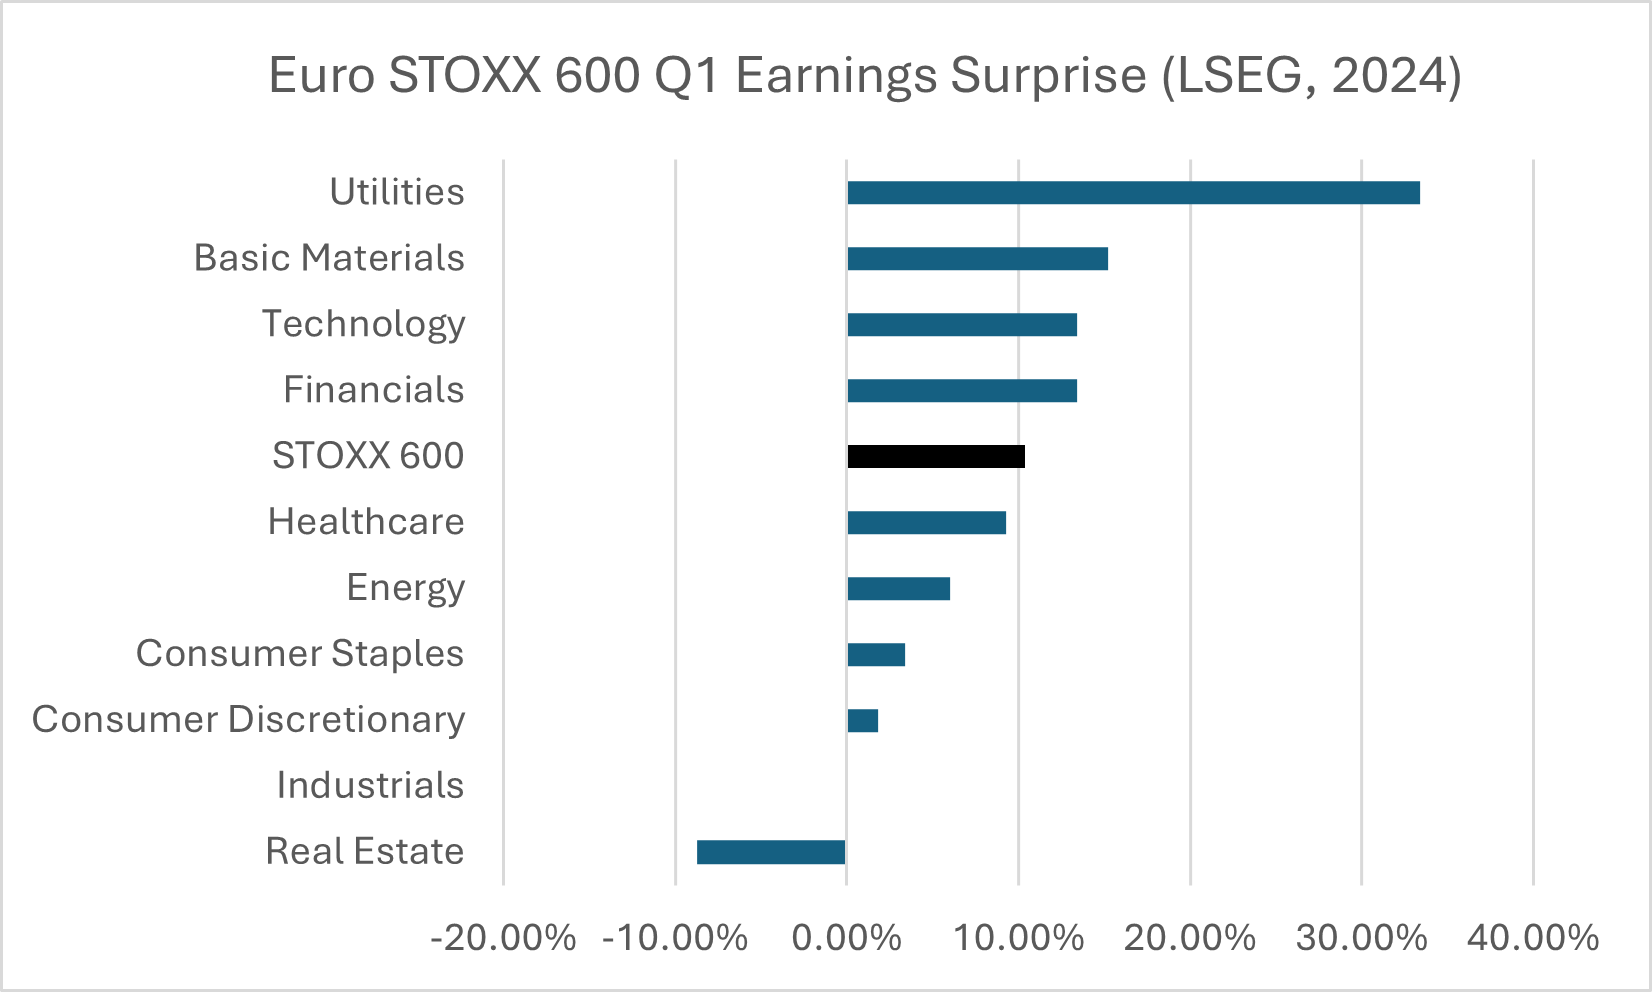 Figure 4 – STOXX 600 Q1 sectoral earnings surprise – Source: LSEG, 2024.
Across the whole market, European companies have beaten expectations by 10%, with only industrials and real estate underperforming expectations.
The second cause for European equity strength was the expectation of an ECB rate cut in June. Inflation has been falling in Europe and has got close to the 2% target, allowing the ECB to make an initial rate cut. This is in the context of a German economy still struggling with the effects of high energy prices, due to the Ukraine war, and increased export competition from China.
UK Markets
The final market that’s worth covering before we touch on elections is the FTSE 250, an index measuring the performance of mid-sized UK companies. The chart below shows the valuation of the FTSE 250 (dark blue line) versus mid-sized companies in other developed markets. The valuation metric used is Price-to-Earnings (P/E), which describes how many pounds you pay in stock price for a pound of company profits.
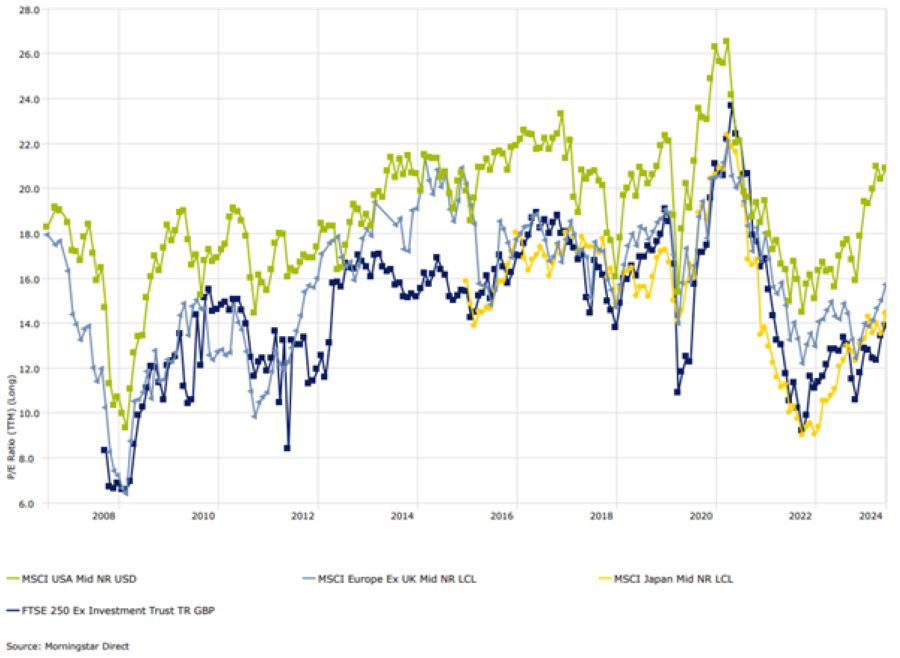
Figure 5 – P/E ratio of mid-cap indices in major developed markets – Source: Morningstar, 2024.
For mid-sized US companies, you are paying £20 for every £1 of company profits, whereas in the UK you only pay £14 for every £1 of company profits. While the US has long traded at a premium, this gap is wider than the long-term average and represents good value to international investors looking for a bargain. Where we have seen the most interest has been from large companies and private equity investors looking to purchase whole companies – recent examples include the £5bn private equity bid for Hargreaves Lansdown and American Industrial Partners £2.5bn bid for Serco. As this inbound merger and acquisition activity has increased, investors have bid up shares they think could be a future takeover target.
Elections
It has been a busy month for elections, with European, Mexican and Indian elections all taking place already, UK and French elections being called, and US election campaigning getting started.
Indian and European elections both caused volatility in their respective markets. Indian equities fell around 8% and then quickly regained that upon Modi’s win. In Europe, the surprise victory of the Le Pen’s National Rally in France during the European Parliamentary elections caused jitters in bond and currency markets. UK and European elections are yet to cause significant volatility but it is expected closer to voting.
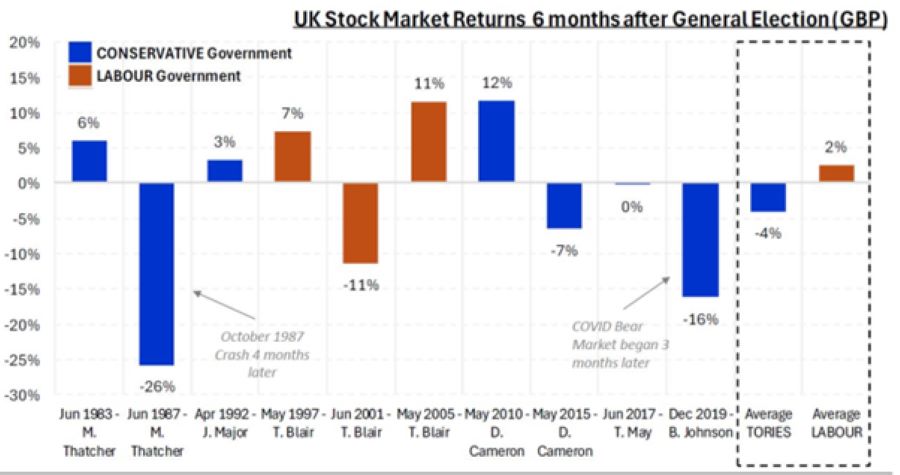
Figure 6 – UK stock market returns 6m after elections – Source: FE Analytics, 2024.
Average returns following a Labour victory, which is expected this election, have been better than under Conservative victories, although this number is distorted by the 1987 and ‘covid’ market crashes. From speaking to fund managers and allocators in the City, most are broadly welcoming of the stability expected under Starmer and Reeves, so the election should be supportive of equity returns.
Conclusion
In conclusion, equity markets continue to move upwards and make all-time highs, despite the bumps in the road felt during April. While performance has varied between regional markets from month to month, reinforcing the value of a diversified portfolio, the general trend is upwards. Political instability, primarily caused by elections, has, and will increase the volatility of markets, however the historical data, at least in the UK, points to the election being supportive of equity returns.
If you have any questions about your portfolio please don’t hesitate to contact your adviser.
Arrange your free initial consultation
This market update is for general information only, does not constitute individual advice and should not be used to inform financial decisions.
Past performance is not a guide to future returns. Investment returns are not guaranteed, and you may get back less than you originally invested.