Skip to main content
Global Markets on Edge: Dissecting the Recent Selloff

August has started with some volatility in investment markets with a number of causes and effects which we will go into in this update, along with some forward-looking discussion. Hopefully this is informative and places the current moves into a wider context. As always, we stress that the recent activity reinforces the need for a portfolio that is diversified across geographies, economic sectors and asset classes, and that risk portfolios should be viewed as long term to reduce the impact of volatility.
Arrange your free initial consultation
Starting with the macroeconomic context, inflation had been steadily falling through the year and there were initial signs of the economy cooling, although the speed/magnitude of the economic slowdown was not clear. Prices are set by the relative match between demand and supply, meaning falling inflation can reflect rising supply or falling demand - markets had been increasingly leaning towards falling demand as the main cause, especially as retail sales numbers began to falter and consumers increasingly found it harder to obtain credit. The labour market looked like it was becoming more balanced, with wage growth slowing and vacancies falling, but the fear was that this process would continue, leading to excessive unemployment and a rapid slowdown in economic growth.
In markets, the context was of overstretched technology valuations resulting from a small number of tech firms driving the bulk of market returns over the last couple of years, as well as very low levels of volatility. While markets frequently display momentum characteristics in which existing trends amplify themselves, in this case tech outperformance and low volatility begetting further tech outperformance and lower volatility, they also eventually correct themselves. The painful element is the rapidity of that snap-back to reality. Over the last few weeks investors started to question the ability of tech firms to drive near-term profitability from their enormous capital investment in AI models and infrastructure, bringing this correction event closer into view.
A final markets context was the extent of the Yen “carry trade”, in which investors from around the world borrowed at low rates in Japan to buy higher yielding/returning risky assets abroad. The scale of this trade is disputed, but numbers as high as $2tn or even $4tn have been proposed. When volatility is low and Japanese interest rates remain pinned to the floor this trade can pay off handsomely, however a rise in Japanese interest rates and rapid strengthening of the Japanese Yen can throw this trade off and cause investors to sell the risk assets they bought using borrowed Yen.
The crowded ‘long-technology vs short-small cap’ trade starts to unwind
A very popular trade, particularly for large institutional investors, has been to go long US tech balanced against a short position in US small caps. This means buying US tech paired against selling of US small caps. This trade is usually implemented with significant leverage to boost returns. US tech has seen strong earnings growth while small caps have been squeezed particularly hard by high interest rates, leading to outperformance of US tech, rewarding those in this trade.
As investors became increasingly worried about economic growth in mid-July there was a deleveraging (selling down) of this position. Institutional investors often use leverage for both the long and short side of the trade, so as they cut their overall leverage, they are forced to buy back the stocks they are short and sell the stocks they are long. This meant buying small caps and selling tech. You see this in the returns below, in which small cap (white) rallied and tech (orange) sank from July 11th to 31st:
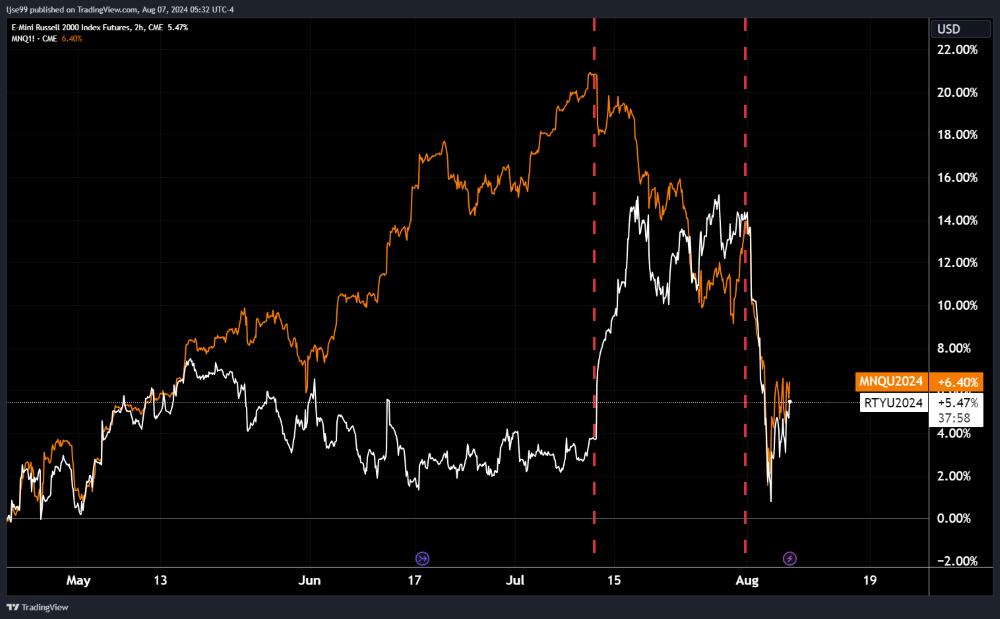 Figure 1 – NASDAQ Index (orange) and Russell 2000 Index (white) returns – Source: TradingView 2024
Japan raises rates, unwinding the “carry trade”
Japan has maintained unusually low interest rates relative to peers in an attempt to spur economic activity and introduce a moderate level of inflation to their long-deflating economy. An unfortunate side-effect has been significant currency weakness.
For those borrowing in Yen to buy foreign assets (the “carry trade”) a weaker Yen is beneficial, as it effectively cuts the cost of your borrowings relative to the value of the foreign asset you have bought – for example, if your borrowed 100 Yen to buy $100 of US assets at a 1:1 rate, but then Yen devalues such that $1 now gets you 2 Yen, you could sell just half of your $100 of assets to fully pay back your 100 Yen borrowings, leaving you in $50 profit. However, that same process works in reverse when the Yen strengthens, potentially pushing the investor to have to sell up their foreign assets to pay back their Yen borrowings.
Last week saw Japanese labour market data released showing a ~5% rise in wages for unionised workers, leading the Bank of Japan to conclude that there was a risk of inflation pushing beyond the moderate levels they targeted and becoming similar to the issues seen in Europe in 2022/3.As a result, they chose to raise interest rates by 0.15%. While the raise itself was small, the signal to markets was large and caused Japanese bond yields to rise in expectation of further rate hikes.
The Japanese Yen then rallied hard, shown in the chart below:
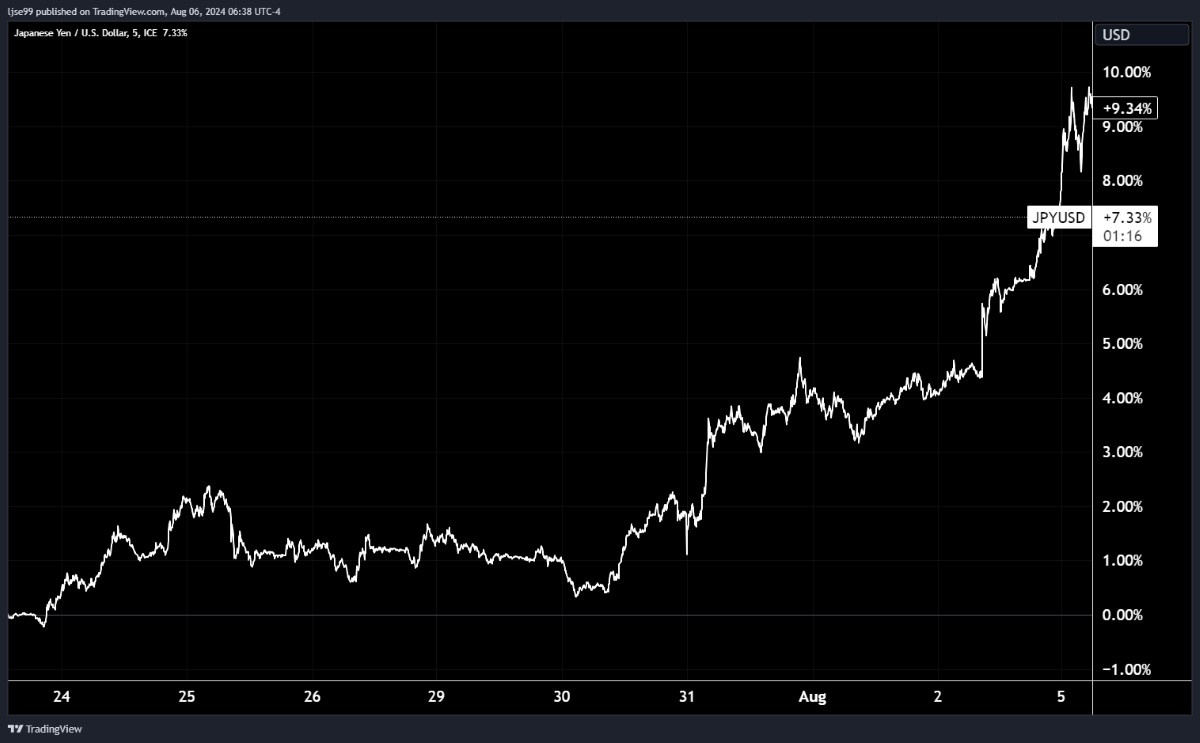 Figure 2 - Japanese Yen versus US Dollar - Source: TradingView, 2024.
Many investors were therefore forced to sell their foreign risk-assets to pay back their Yen borrowings.
Israel-Iran tension rise, increasing geopolitical risk
Although this is not the primary driver, it certainly has contributed to the overall risk-off attitude. Rising tensions in the middle east following Israel’s assassination of Hamas leadership on Iranian soil, along with further Israeli attacks in Syria and Lebanon, led Iran to threaten retaliation and an escalation in tensions. Oil prices jumped and geopolitically sensitive assets dropped, indicating a rise in geopolitical risk premium.
US labour market data indicates the beginning of a recession
Before anything else, it should be stressed that for a recession to be unequivocally marked there needs to be decline in the following 4 indicators: industrial production, personal incomes, employment and retail sales volumes. Friday’s employment data points to the start of employment problems, so is not the official start of a recession, however if those trends in employment persist it can be expected that the other three components also deteriorate.
What was the data? The US economy added 114,000 jobs in July, below the roughly 200,000 jobs needed to keep up with population growth. This meant that unemployment rose sharply from 4.1% to 4.3% in July, up from 3.4% in April 2023.
Historically the US unemployment rate has never risen 1% without a recession occurring shortly afterwards. A similar concept, the Sahm rule, was also triggered, which states that a recession is entered when the 3-month average of unemployment is 0.5% above the minimum unemployment rate of the previous 12-months. Please see the Sahm rule chart below.
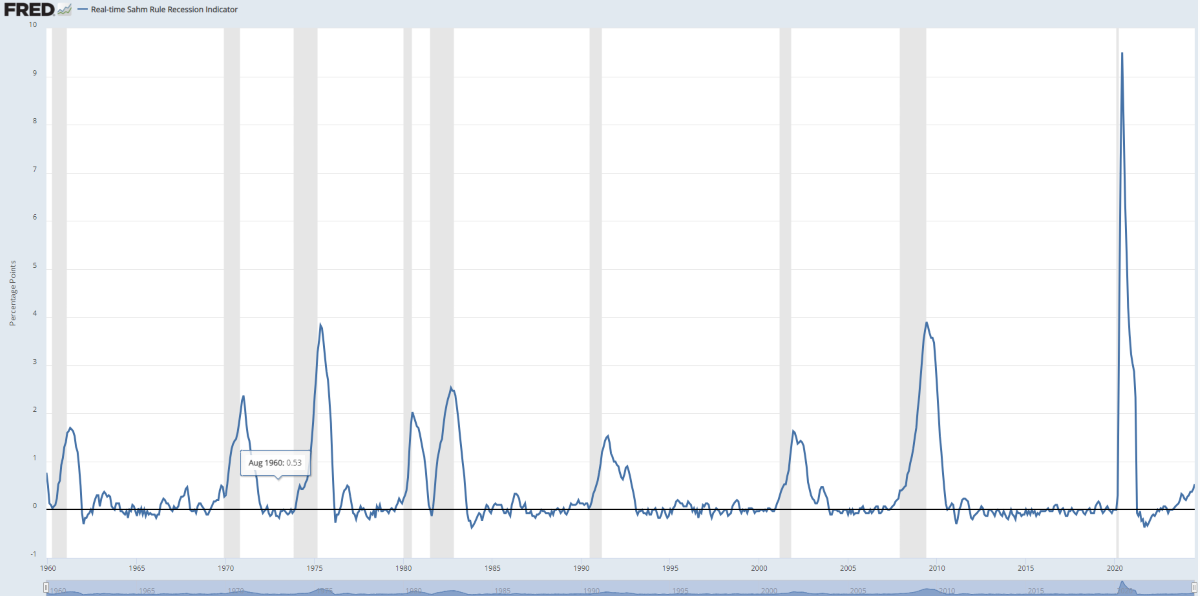 Figure 3 – Sahm Rule, with US recessions shaded – Source: Federal Reserve Bank of St Louis, 2024.
With investors now firmly in the recessionary camp, equity selling became rather indiscriminate, with few names remaining unscathed. Our next section will cover the market moves.
Market moves
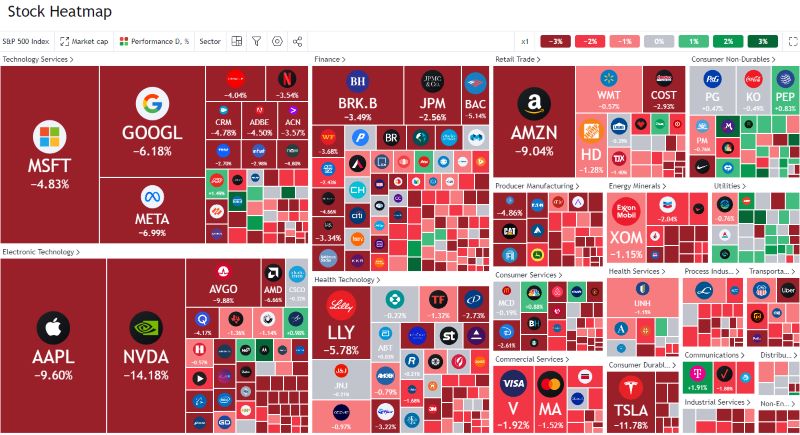 Figure 4 – US stock market heatmap at the US market open 05/08/24 - Source: TradingView, 2024.
Starting with equity markets, the heatmap above shows US equity sectors as US markets opened on Monday. Defensive sectors like consumer staples (labelled consumer durables) and utilities saw positive performance, while most other sectors have seen rapid declines. Notably, many of the most overvalued technology names saw the most rapid price declines. Through the trading day equities subsequently rebounded and regained much of the value they lost. Although equities rebounded, volatility is high, with the VIX volatility index hitting 49 intraday and settling closer to 30; 49 is a level last seen during the 2020 COVID crash:
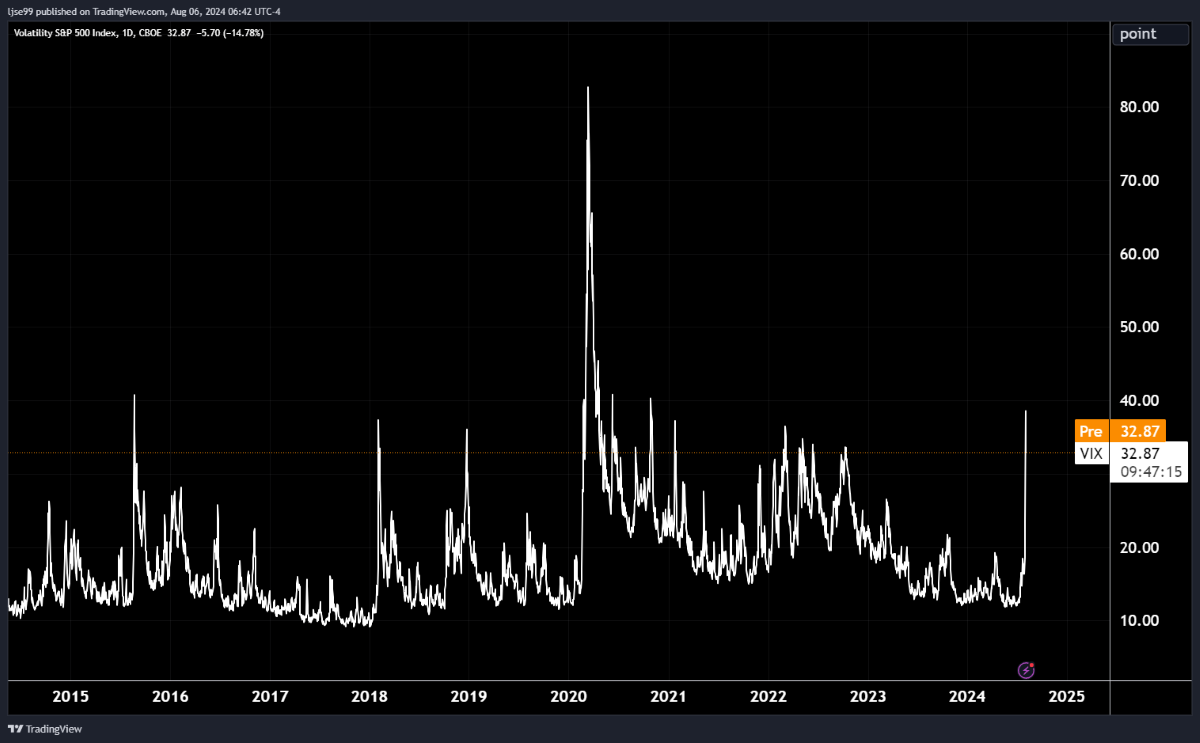 Figure 5 – VIX Volatility Index – Source: TradingView, 2024.
On a country level selling was fairly indiscriminate, and Japan, which is at the centre of the carry trade, was hit hardest:
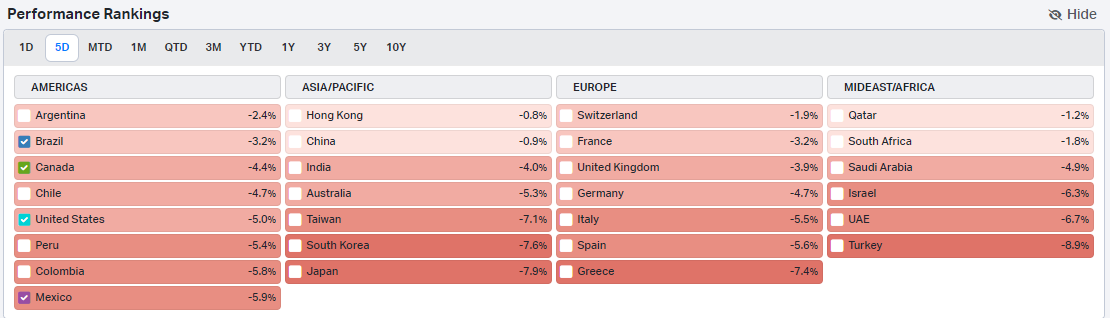 Figure 6 – National stock market returns 05/08/2024 - Source: Koyfin, 2024.
In the following hours, particularly the second half of the US trading session, Japanese equities also rebounded and made up around half of their losses.
In terms of currencies, there has been a strong safe-haven effect, as investors pull money home, or crowd into currencies perceived as safe havens. Unsurprisingly the Japanese Yen has rallied hard as the increase in Japanese interest rates has made it more attractive, continuing the strength that originally unwound the carry trade. The Swiss Franc, a typical safe-haven, has rallied. The Euro has seen repatriation flows from nervous European investors. All are typical signs of risk-off mentality.
Finally, moving to bonds and fixed income where the safe-haven effect has also been very apparent. Investors crowded into safe government bonds, betting on imminent emergency rate cuts (more on this below). High yield credit sold off, as investors bet on slowing growth causing increased corporate bankruptcies.
The rapidity of this recent move in fixed income yields is quite extraordinary and is well characterised in the following graph, showing US 2-year yields in white and US 10-year yields in orange:
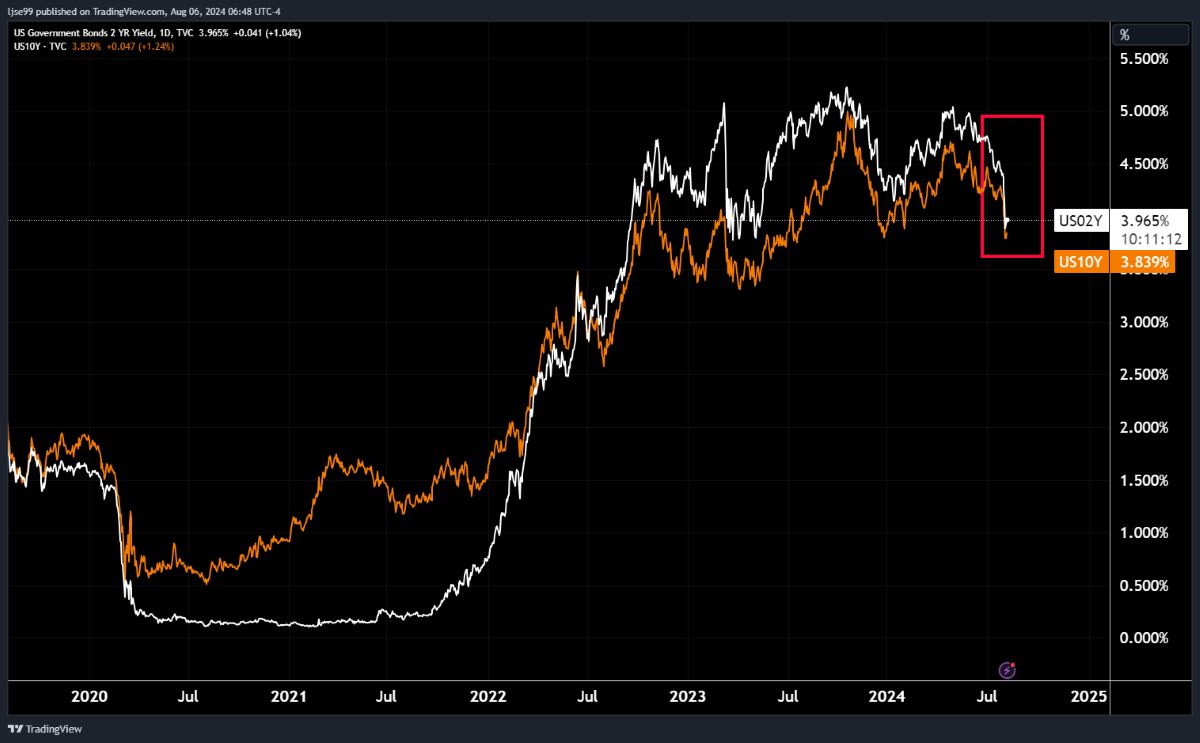 Figure 7 – US 10-year (orange) and 2-year (white) yields – Source: TradingView, 2024.
Yields declined -0.5% in the space of hours– you would normally expect to only see moves this large once every 10 years. Bond yields gyrated rapidly through the day, with the US 2-year yield subsequently gaining 0.3%, leaving the net daily change in yields close to –0.2%.
Where do we go from here?
The Federal Reserve just had a Federal Open Market Committee (FOMC) meeting in which they chose to keep rates on hold, in contrast to the Bank of England who cut rates. Markets are now assigning a 16% probability to an emergency rate cut in the next two weeks. Beyond that, they are also predicting a double rate cut at the September FOMC meeting, 5 rate cuts by the end of 2024, and 7 cuts by March of 2025. If markets are correct, that would leave interest rates below 4% for the first time since December 2022.
While this will certainly bring hope to investors in government bonds, as mechanically they will have to appreciate in value as interest rates fall, the outlook for risk assets is more sanguine. History has shown that Central Banks cut interest rates just as an economy enters recession and do not prevent recession (although they may shorten it), and risk assets typically fall in the 6-24 months following the implementation of a cutting cycle – it took until March of 2009 for equities to bottom out, yet rates were first cut in August of 2007, meaning nearly 2 full years of declines. That said, circumstances are very different now compared with 2008. Banks are much stronger and better regulated so a credit crunch is unlikely. However, this could mean that we are possibly in for a bumpy ride in the near future.
Economies enter recessions when imbalances, whether in the financial system or real economy, become too extreme to paper-over and lead to outright ruptures. In 2007 the main imbalances were between booming sub-prime home lending and deteriorating borrower credit quality, along with extreme imbalances in commercial bank balance sheets. This blew up, but it laid the foundations for more sustainable growth from 2009 onwards that no longer relied on excessive buildup of household debts. Similarly, we now see enormous imbalances between the outcomes of large and small companies, in trading relations between the US and China, in demand and supply of commercial real estate, in US budget deficits versus economic growth. While a recession, if it happens, will be painful, it will also hopefully allow for future growth that is built upon more sustainable foundations. Additionally, from an investor perspective, will allow for enticing entry points into risk assets for those who are in their accumulation phase.
Let us hope, however, that this all turns out to just be a growth scare, rather than an actual recession.
There are ways to ensure that turbulent market environments do not have a significantly adverse impact on your invested wealth. Investing for the long term and picking appropriate risk mandates helps ensure that you will not need to draw on money that suffers greatly from short term volatility. At The Private Office we invest our clients wealth in portfolios which have been selected to benefit from long term growth in line with each individual’s needs and objectives. If you have any questions about your portfolio, please contact your adviser.
Arrange your free initial consultation
The information in this article is correct as at 07/08/2024.
This Market update is for general information only, does not constitute individual advice and should not be used to inform financial decisions. Investment returns are not guaranteed, and you may get back less than originally invested; past performance is not a guide to future returns.